Highlight/outline current transcript in Gene Structure Model Displayer #23
Description
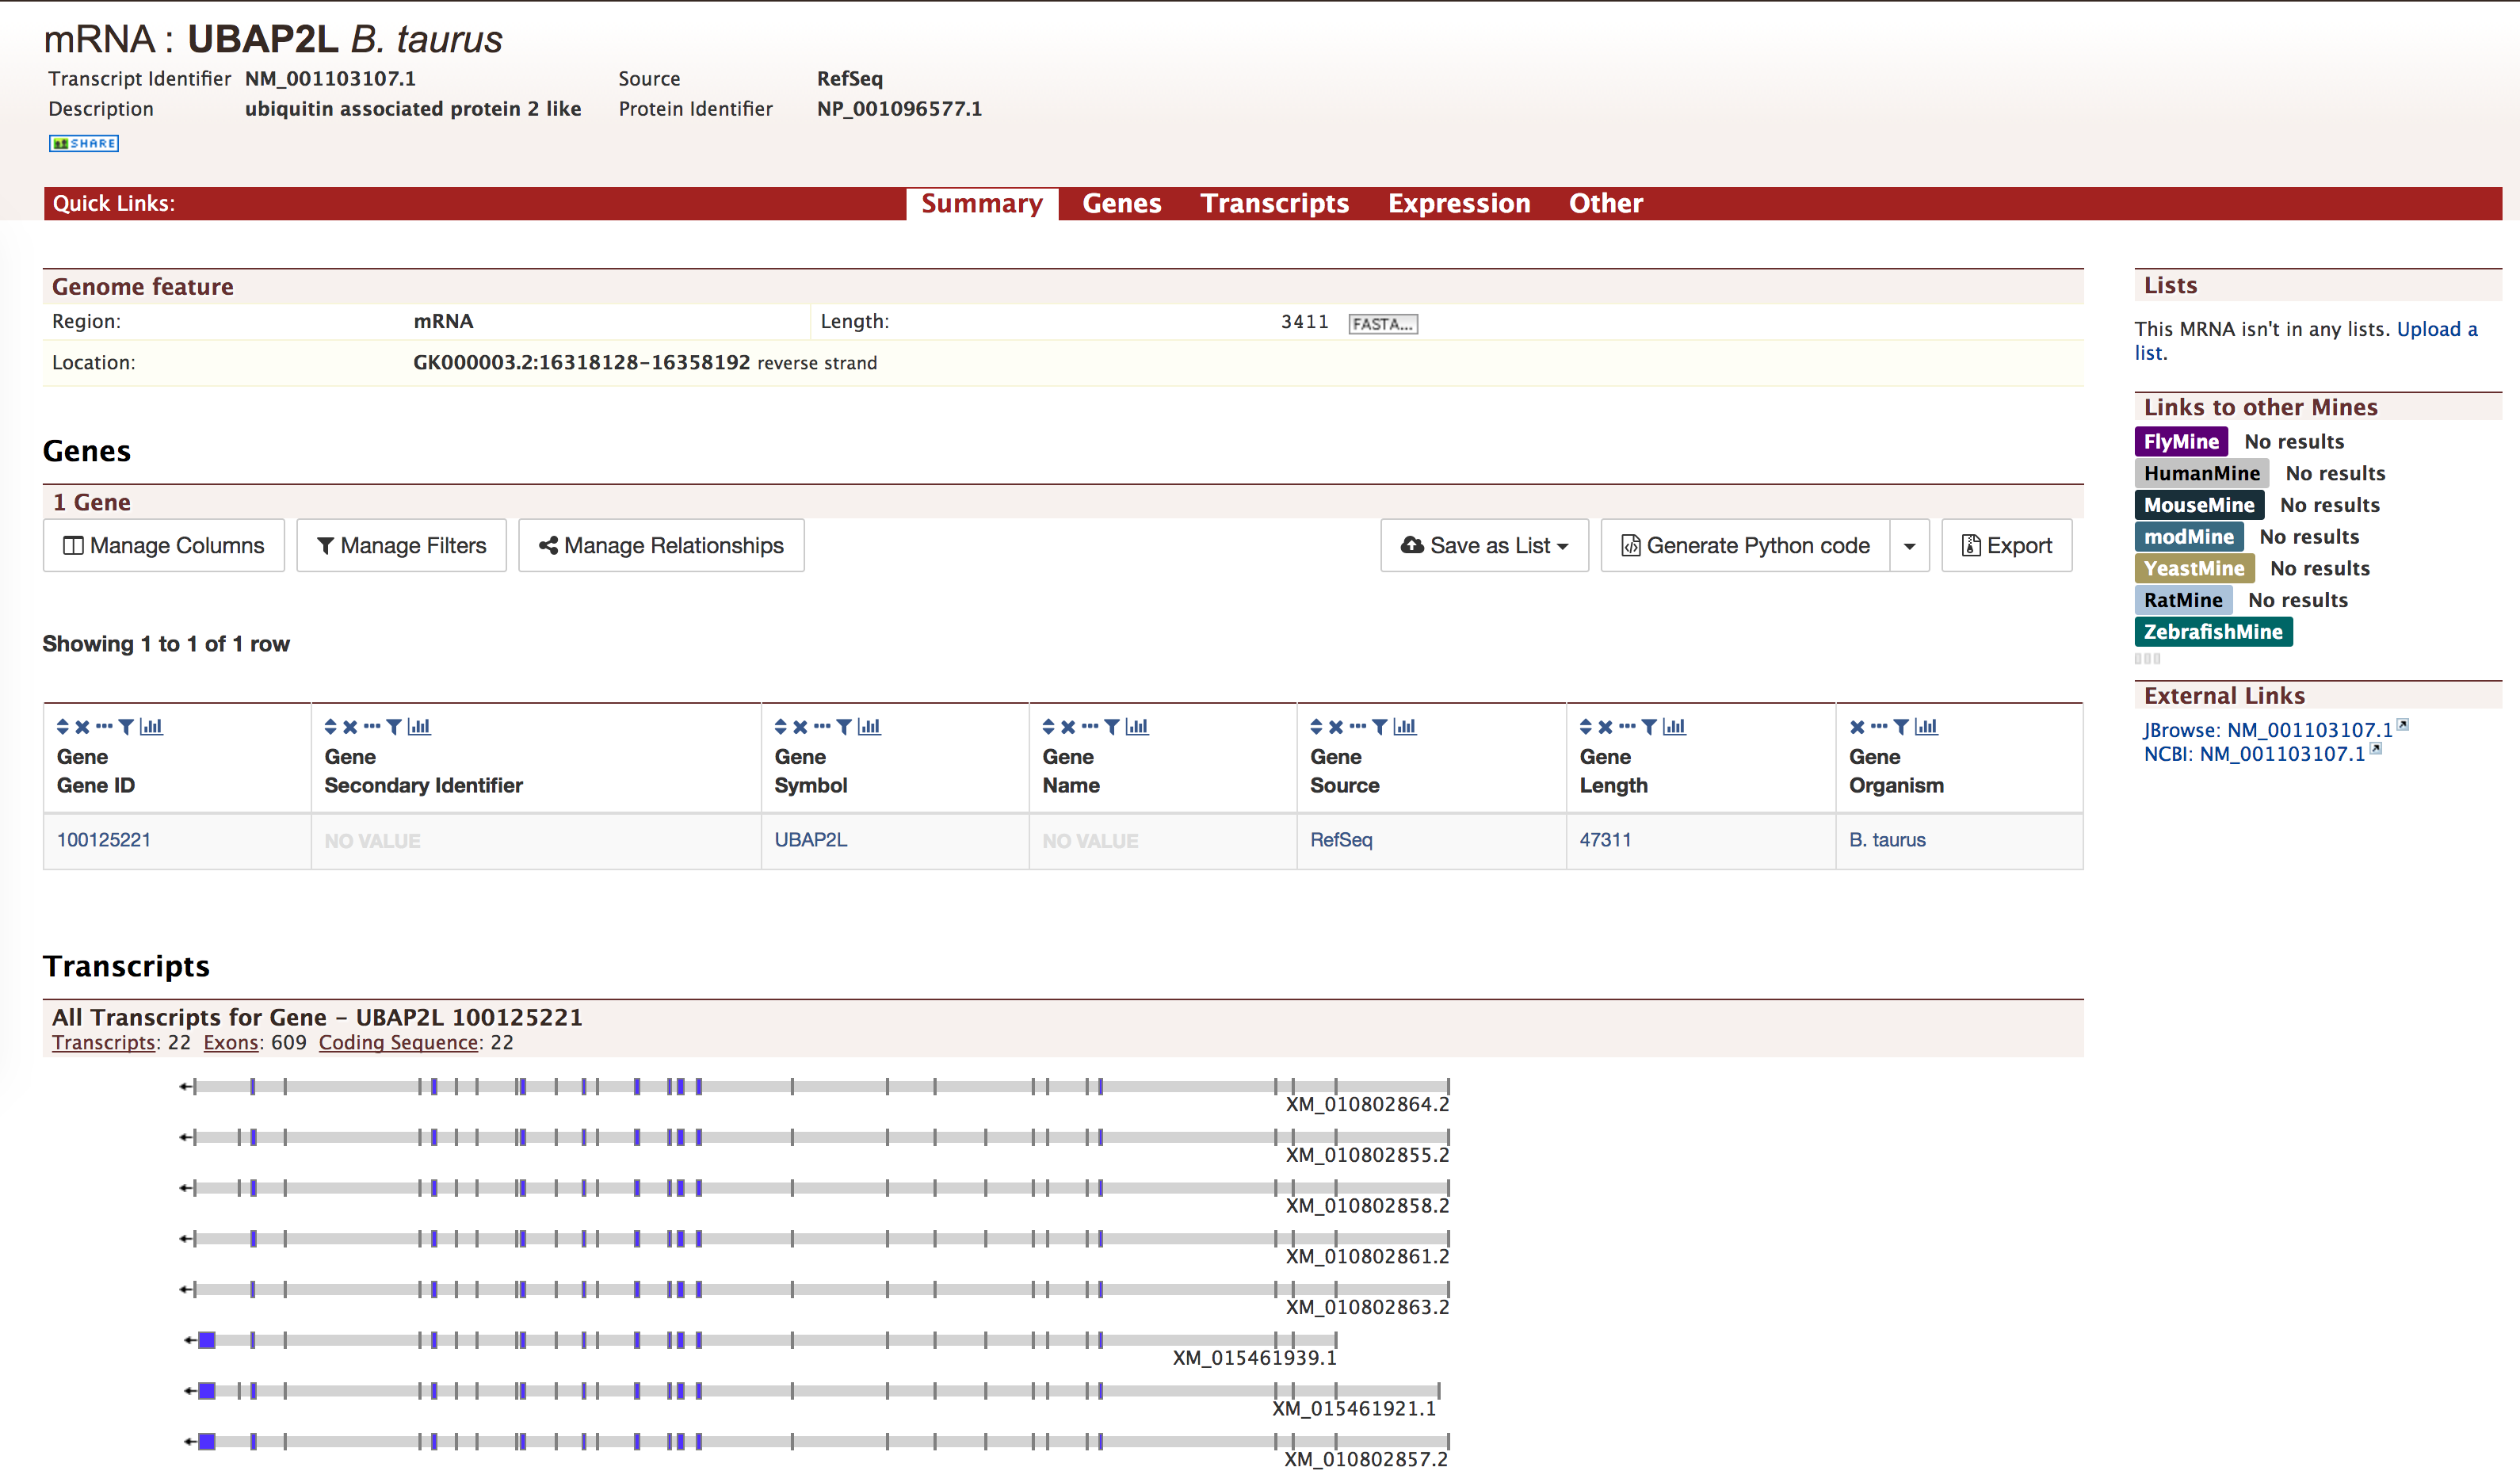
Highlight or draw an outline around the current transcript in Gene Structure Model Displayer when in a transcript report page.
This is particularly helpful when looking at a transcript report page that has a high number of alternative isoforms.
Ex: