Error in the Package, Hotteling T2, Phase I, UCL #1
Description
The following table shows the value we want to use on the following parts:
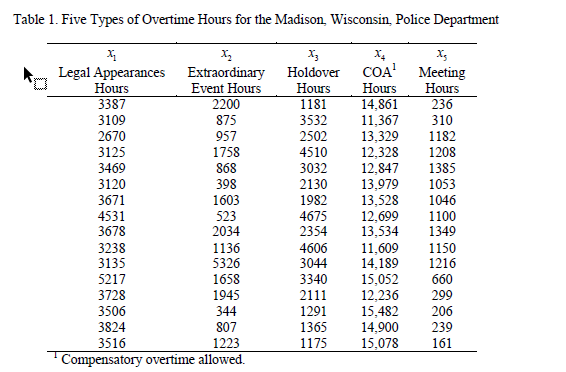
Column x3 and x4 are used to produce the following figures assuming phase I and n=1 for Hotelling T2. The first figure is based on my script and the second figure is based on the package.
As it can be seen, these two figures are not the same. I believe the reason is that you did not use the correct formulation for calculation UCL for n=1 and phase I. the following formula should be used based on Introduction to Statistical Quality Control, DOUGLAS C. MONTGOMERY, seventh edition.
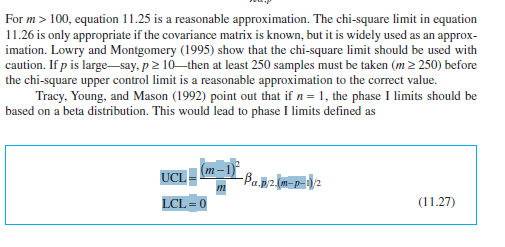
The formula which is used in the package is:
if(n == 1)
{
    Q <- (2 * (m - 1) ^ 2) / (3 * m - 4)
    UCL <- (((m - 1) ^ 2) / m) * qbeta(1 - 0.0027, p / 2, (Q - p - 1) / 2)
    plot(1:m, T2, main = "Hotelling T2: Individual Observations - Phase I", ylim = c(0, UCL + 1), ylab = "T2")
}
I'm also going to a word file about this problem and an R script.
#################################################################################
clc <- function() cat(rep("\n", 50))
rm(list = setdiff(ls(), lsf.str()))
wants <- c("ICSNP", "mvtnorm","IQCC")
has <- wants %in% rownames(installed.packages())
if(any(!has)) install.packages(wants[!has])
for (pkg in wants) {library(pkg, character.only = TRUE)}
clc()
##########################################################################################
Generating Input Data
x1 <- c(3387,3109,2670,3125,3469,3120,3671,4531,3678,3238,3135,5217,3728,3506,3824,3516)
x2 <- c(2200,875,957,1758,868,398,1603,523,2034,1136,5326,1658,1945,344,807,1223)
x3 <- c(1181,3532,2502,4510,3032,2130,1982,4675,2354,4606,3044,3340,2111,1291,1365,1175)
x4 <- c(14861,11367,13329,12328,12847,13979,13528,12699,13534,11609,14189,15052,12236,15482,14900,15078)
x5 <- c(236,310,1182,1208,1385,1053,1046,1100,1349,1150,1216,660,299,206,239,161)
X <- t(rbind(x3,x4)) # we just need x3 and x4
alpha <- 5/100
m <-dim(X)[1]
p <-dim(X)[2]
n=1 # number of observation per sample
Phase=1 # phase I or II for Hotelling T2
##########################################################################################
#calculation process
Sigma <- cov(X,X)
Mean <- matrix(0,1,p)
for (i in 1:p) {
Mean[1,i]=mean(X[,i])
}
MEAN <- matrix( rep(Mean,m), byrow = TRUE,ncol=p)
MuMatrix=X-MEAN
T2 <- matrix(0, m, 1)
for (i in 1:dim(MuMatrix)[1]) {
T2[i,1] <- n * t(MuMatrix[i,]) %% solve(Sigma) %%(MuMatrix[i,])
}
#calculation of Control limits
if (n==1 && Phase==1){
LCL= (m-1)^2/m* qbeta(alpha/2, p/2, (m-p-1)/2, ncp = 0, lower.tail = TRUE, log.p = FALSE)
MCL= (m-1)^2/m* qbeta(0.5, p/2, (m-p-1)/2, ncp = 0, lower.tail = TRUE, log.p = FALSE)
UCL= (m-1)^2/m* qbeta(1-alpha/2, p/2, (m-p-1)/2, ncp = 0, lower.tail = TRUE, log.p = FALSE)
}
if (n==1 && Phase==2){
LCL= p*(m-1)(m+1)/m/(m-p) qf(alpha/2, df1=p, df2=m-p)
MCL= p*(m-1)(m+1)/m/(m-p) qf(0.5, df1=p, df2=m-p)
UCL= p*(m-1)(m+1)/m/(m-p) qf(1-alpha/2, df1=p, df2=m-p)
}
#Ploting
plot(T2,xlim=c(1,m),ylim=c(LCL-0.2abs(LCL), UCL+0.2abs(UCL)) ,xlab="Sample", ylab="Value",pch=16,col="blue", cex = 2 )
LineUp <- list(x=c(0,m),y=c(UCL,UCL))
LineMean <- list(x=c(0,m),y=c(MCL,MCL))
LineDown <- list(x=c(0,m),y=c(LCL,LCL))
lines(LineUp,col="red",lwd = 3 )
lines(LineMean,col="red" ,lwd = 2 )
lines(LineDown,col="red" ,lwd = 3 )
lines(T2)
par(new=TRUE)
plot(which(T2>UCL),T2[which(T2>UCL)],xlim=c(1,m),ylim=c(LCL-0.2abs(LCL), UCL+0.2abs(UCL)) ,xlab="Sample", ylab="Value",pch=16,col="red", cex = 2 , ann=FALSE, axes=FALSE)
par(new=TRUE)
plot(which(T2<LCL),T2[which(T2<LCL)],xlim=c(1,m),ylim=c(LCL-0.2abs(LCL), UCL+0.2abs(UCL)) ,xlab="Sample", ylab="Value",pch=16,col="red", cex = 2 , ann=FALSE, axes=FALSE)
######################################################################################
#Using R package
estat <- stats(X, m, 1, p)
if (n==1 && Phase==1){
T21=T2.1(estat, m, 1)
cchart.T2.1(T21, m, 1, p)
}