Rework Dashi and create a Lasagne config to display a control chart for website traffic #10
Description
We want to create a dashboard for the third floor to display the health of our sites to the tech team. The idea is that the tech team can see at a glance if there have been any noteworthy spikes, dips, or trends in traffic across any of the sites. This could indicate whether a new release has introduced some sort of breakage or to verify reports from other teams about site traffic spikes/dips.
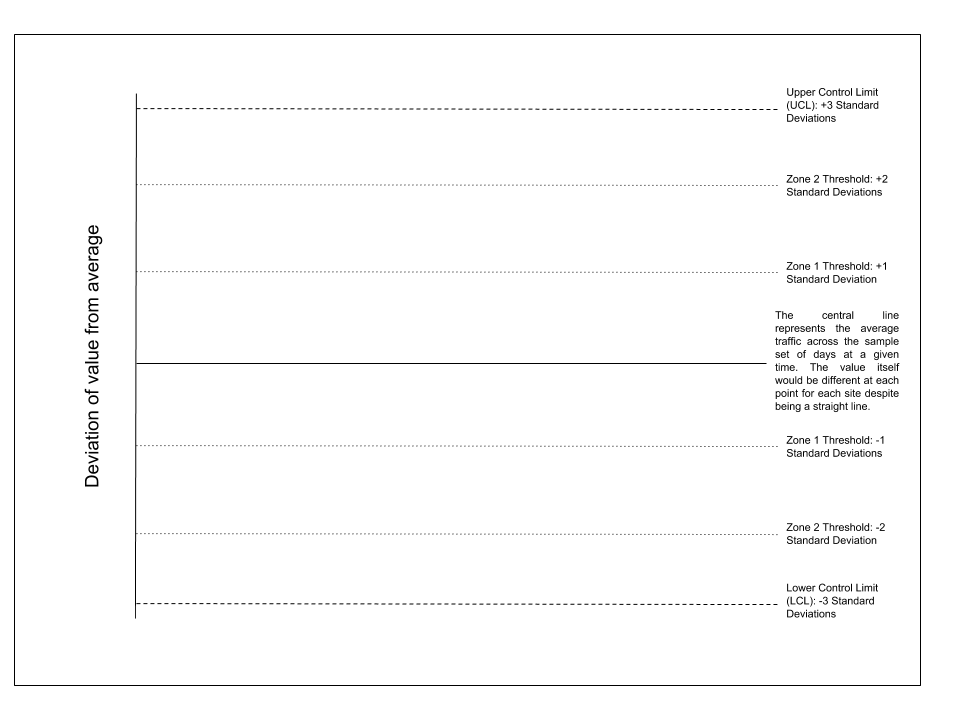
The current proposed approach to this is to create a control chart. Control charts use standard deviation to measure whether values are within 'statistical control'. Criteria which might determine 'out of control' conditions would include: (1) values which exist outside of the control limits (+/- 3 sigma/standard deviations); (2) values which do not display a normal pattern of variation; (3) sharp trends.
This is a useful link on control charts:
http://www.cqeweb.com/Chapters-HTML/Chap7_html/chapter7.htm
Its not straightforward how we determine meaningful limits for the chart which would handle the usual trends in site traffic appropriately. Meaningful limits for the chart could be obtained by using samples of ~5 previous days (preferably the same day of the week). To handle all of this data processing, a new step would need to be introduced into the current Lasagne/Dashi model which could store the data of the previous days as well as all updates ti the current day's traffic stats.
Here's a moderately helpful diagram of how it would work: