A website project made in my Web Programming Class. Utilizing a ReactJS/ViteJS frontend, as well as a NodeJS/Express backend, the website provides a graph of various California reservoir water levels at any given month of the year. The goal of the program was to learn how to work with ReactJS, as well as how to properly implement a decoupled frontend and backend into our websites.
This project was worked on by a team of 2, consisting of myself and my partner. The project was coded on Replit, and was later exported to Github.
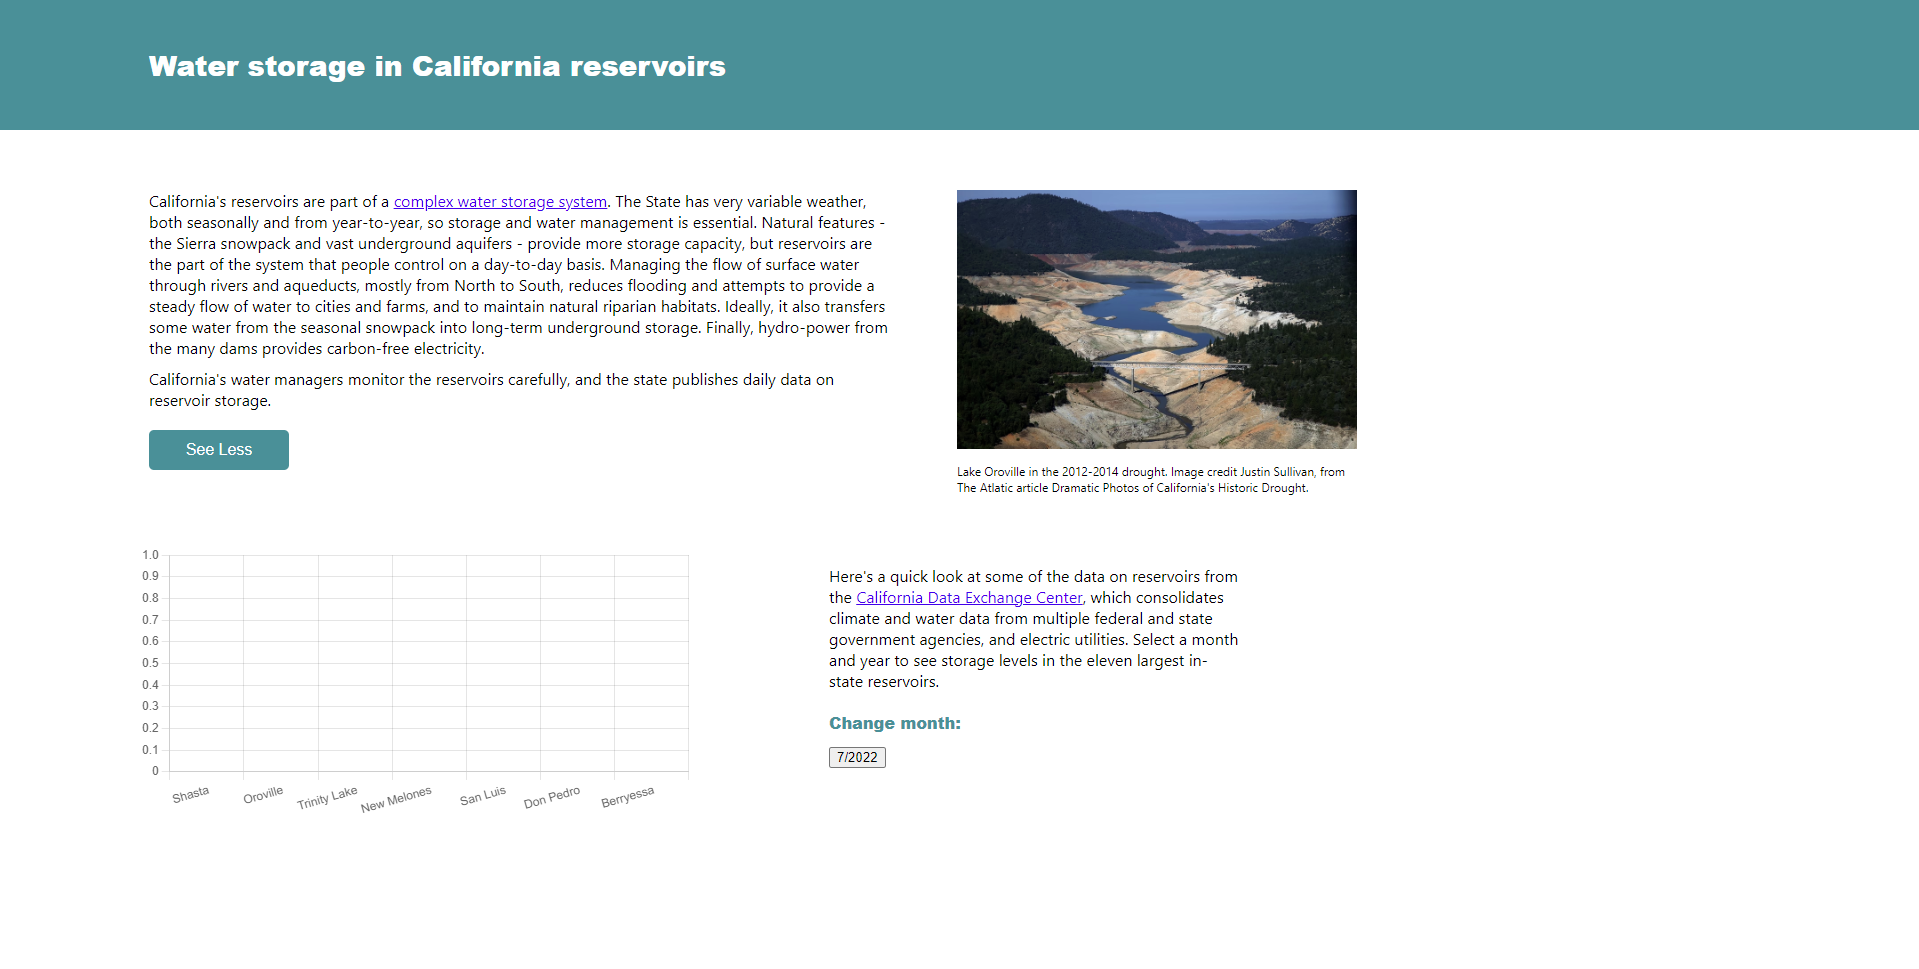
We were given a mockup design from our professor, and we were tasked to make our website look like the design. To get the data for the reservoir water levels, the server utilizes an API call to the California Data Exchange Center. The server then extracts the important data, and sends it to the frontend to be displayed neatly on the website. Below is an example of what our website looks like when compiled and run.