3D codebase visualization engine. Parses source code into a navigable force-directed graph.
Video showing 3,250-node galaxy explosion with real-time parsing and navigation:
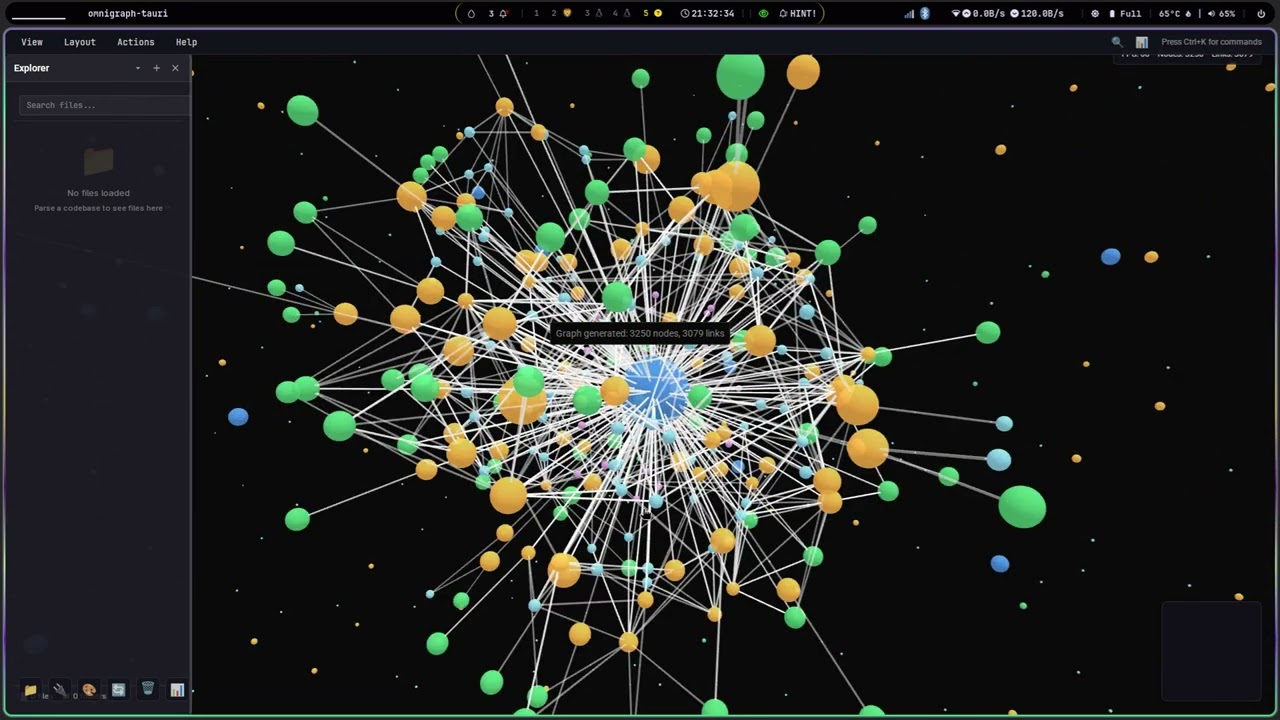
Omnigraph is a desktop application that turns codebases into interactive 3D visualizations. It uses Tree-sitter to parse multiple languages, builds a dependency graph, and renders it in real-time using Three.js and WebGL.
The result is a galaxy-like view of your code where you can see architecture, coupling, module boundaries, and structural problems at a glance. Node size reflects importance. Colors indicate type. Distance shows coupling strength.
Built on Tauri (Rust backend), TypeScript frontend, and a custom parsing pipeline. Handles thousands of nodes without choking.
Started as a test: how far could I push Claude Code on a technically deep project with minimal manual intervention?
Turns out: pretty far.
Currently build is failing due to dependency conflicts. Currently working as quickly as I can to rectify this.
Successfully renders 3,250 nodes and 3,079 edges from real codebases. The visualization is functional and the core pipeline works.
What's Working:
- Multi-language AST parsing (JavaScript, TypeScript, Python, C)
- Parallel batch processing with progress indicators
- Dependency graph construction with import resolution
- 3D force-directed visualization with smooth rendering
- Interactive navigation (rotate, zoom, pan, click)
- Real-time progress UI during parsing
- Color-coded node types
- Semantic structure visible in the layout
- Desktop app with panels, file tree, keyboard shortcuts
What's Implemented But Not Visible:
- 15+ graph algorithms (PageRank, betweenness, community detection, etc.)
- Composite metrics (importance, risk, chokepoint scoring)
- Analytics engine with timeout protection and error recovery
What's Stubbed Out:
- Neo4j integration (5% done)
- Metrics display in UI (computed but not shown)
Accidentally ended up with a visualization tool that looks like a sci-fi HUD. The remaining gap is UI wiring.
Backend (Rust):
- Tree-sitter parsers for JS/TS/Python/C
- Petgraph for graph data structures
- Rayon for parallel processing
- Analytics engine with 15+ algorithms
- Tauri commands for frontend communication
Frontend (TypeScript):
- 3d-force-graph for WebGL rendering
- Lit web components for UI
- Event-driven state management
- Panel system with docking and floating modes
- Command palette (VS Code style)
Workspace:
- 11 Rust crates organized by domain
- Modular metrics system (centrality, community, quality, risk)
- ~12,000 lines of Rust
- ~7,600 lines of TypeScript
Requires Node.js, Rust, and Tauri prerequisites.
git clone https://github.com/yourusername/omnigraph.git
cd omnigraph
pnpm install
pnpm tauri:dev
Build for production:
pnpm tauri:build- Launch the app
- Click "Parse Codebase" and select a directory
- Wait for parsing (progress bar shows status)
- Click "Generate Graph"
- Navigate the 3D view:
- Left-click drag: rotate
- Right-click drag: pan
- Scroll: zoom
- Click node: focus camera
It's about 75% of a usable tool. The remaining 25% is mostly polish and tuning on the core engines.
High Priority:
- Wire computed metrics to UI (HUD overlay, properties panel)
- Visual encoding of risk/importance on nodes
- Node inspector with full metric breakdown
- Metric filtering and sorting controls
- Export metrics to JSON
Medium Priority:
- Fix destructured import detection in JavaScript parser
- Optimize community detection (currently disabled for performance)
- Add incremental parsing for large codebases
- Improve C parser coverage
- Better error messages
Low Priority:
- Finish Neo4j integration or remove it cleanly
- Add more language parsers (Rust, Go, Java)
- Git history analysis for churn metrics
- Cyclomatic complexity from AST
- CLI mode for headless analysis
- Architecture overlay modes (layers, boundaries, violations)
Early beta. Functional core, incomplete UI integration, visually complete.
The parsing engine works. The graph rendering works. The analytics engine computes everything correctly. The gap is displaying computed data in the interface.
Not production-ready. Not optimized. Not stable. But it renders 3,250 nodes in 3D and looks good doing it.
- Open-source dev tool for architecture exploration
- Code forensics and dependency analysis
- Teaching aid for software architecture
- Visual debugging of coupling and structure
- Cool factor
Supported Languages:
- JavaScript (.js, .jsx, .mjs, .cjs)
- TypeScript (.ts, .tsx)
- Python (.py)
- C (.c, .h) - partial support
Graph Algorithms Implemented:
- PageRank with convergence detection
- Betweenness centrality (sampled for large graphs)
- Closeness centrality
- Degree centrality (in/out/total)
- Eigenvector centrality
- Clustering coefficient
- K-core decomposition
- Louvain community detection
- Coupling and cohesion metrics
- Risk scoring and chokepoint detection
Performance:
- Handles 3,000+ nodes smoothly
- Parallel parsing with Rayon
- Timeout protection on expensive algorithms
- Fallback mechanisms for edge cases
- Progress reporting throughout pipeline
- Large codebases (>10k files) take time to parse
- Community detection too slow for production (disabled)
- Import resolution has edge cases (destructured imports, dynamic requires)
- Metrics computed but not displayed
- No incremental parsing yet
MIT
Project link: https://github.com/Critlist/omnigraph