This document outlines the steps necessary to generate the figures for the manuscript Type-I nNOS neurons orchestrate cortical neural activity and vasomotion by Kevin L Turner, Dakota F Brockway, Md Shakhawat Hossain, Keith R Griffithm Denver I Greenawalt, Qingguang Zhang, Kyle W Gheres, Nicole A Crowley, and Patrick J Drew.
The code in this repository generates all main figures, supplemental information, and statistics. It also contains the analysis code for all pre-processing steps.
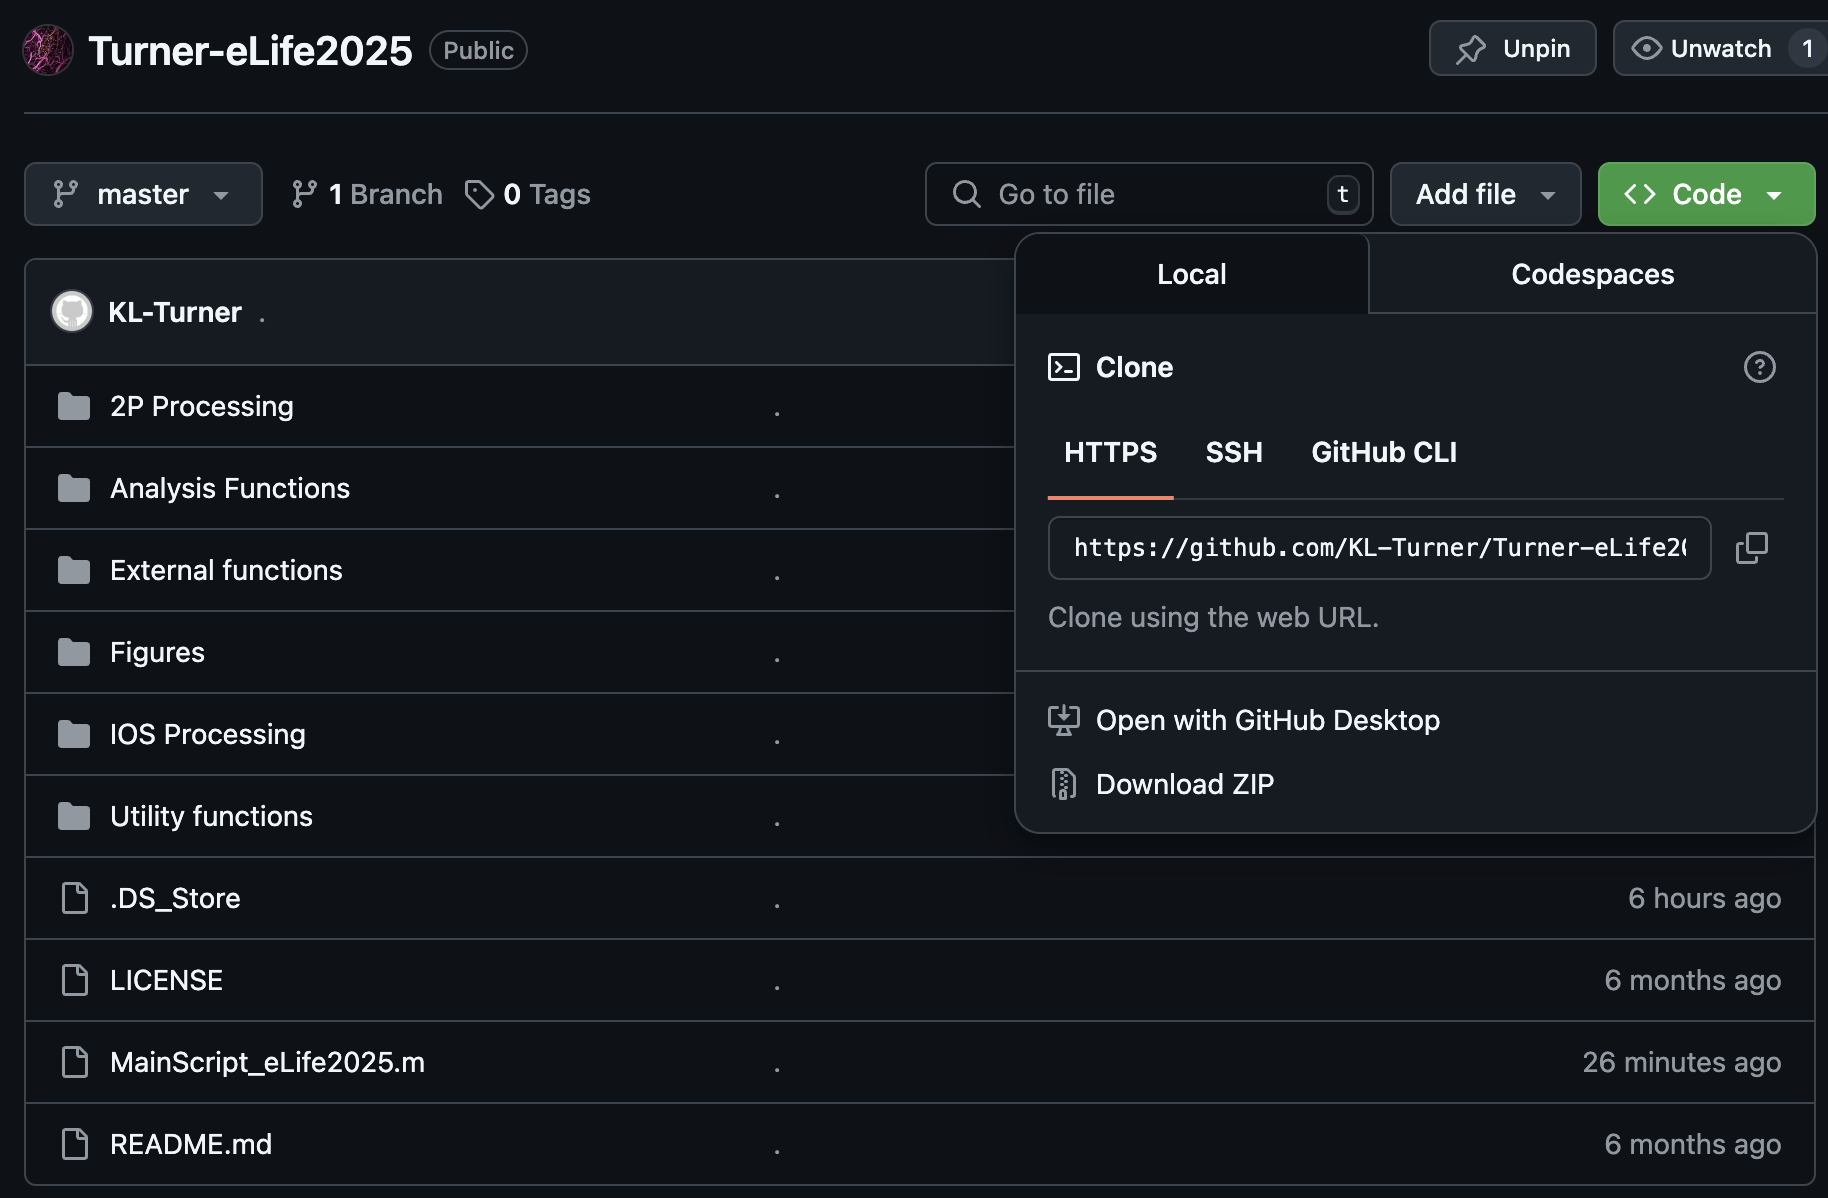
Begin by downloading the code repository by clicking the green Code button at the top of the page and selecting Download ZIP.
- Code repository location: https://github.com/KL-Turner/Turner-eLife2025
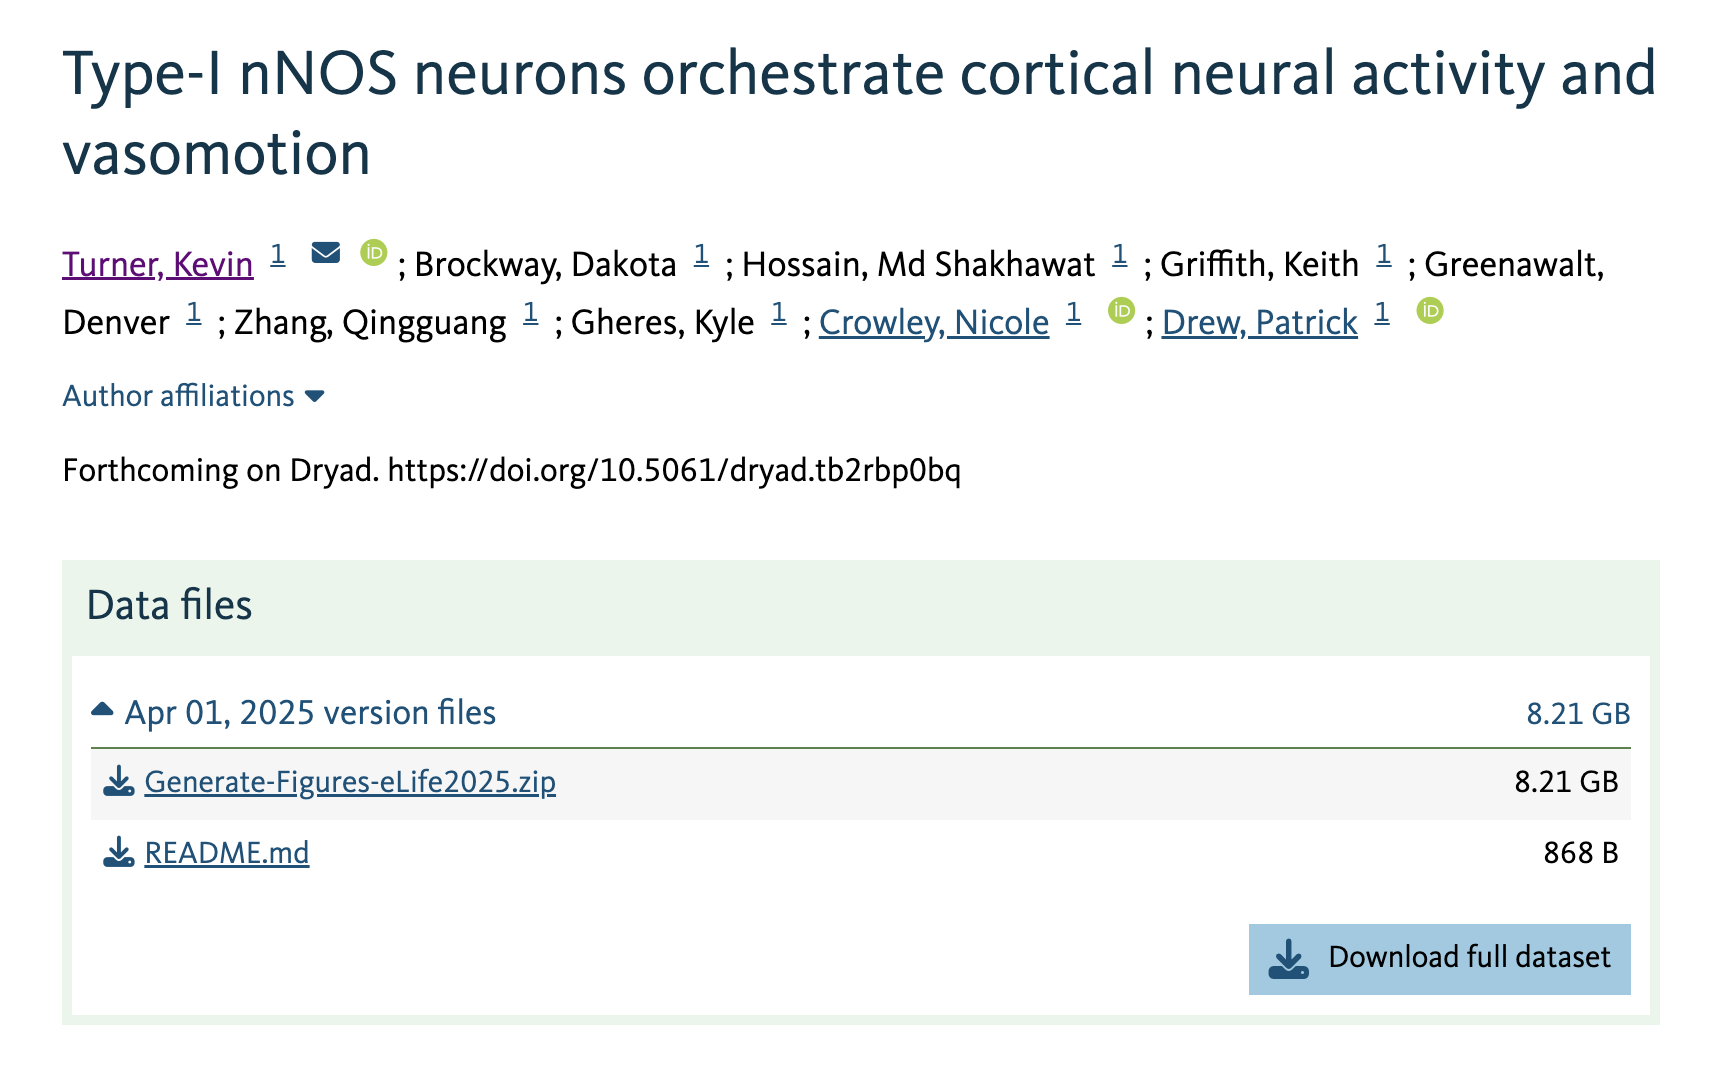
Next, the data (~7 GB) can be downloaded from the following location: https://doi.org/10.5061/dryad.tb2rbp0bq
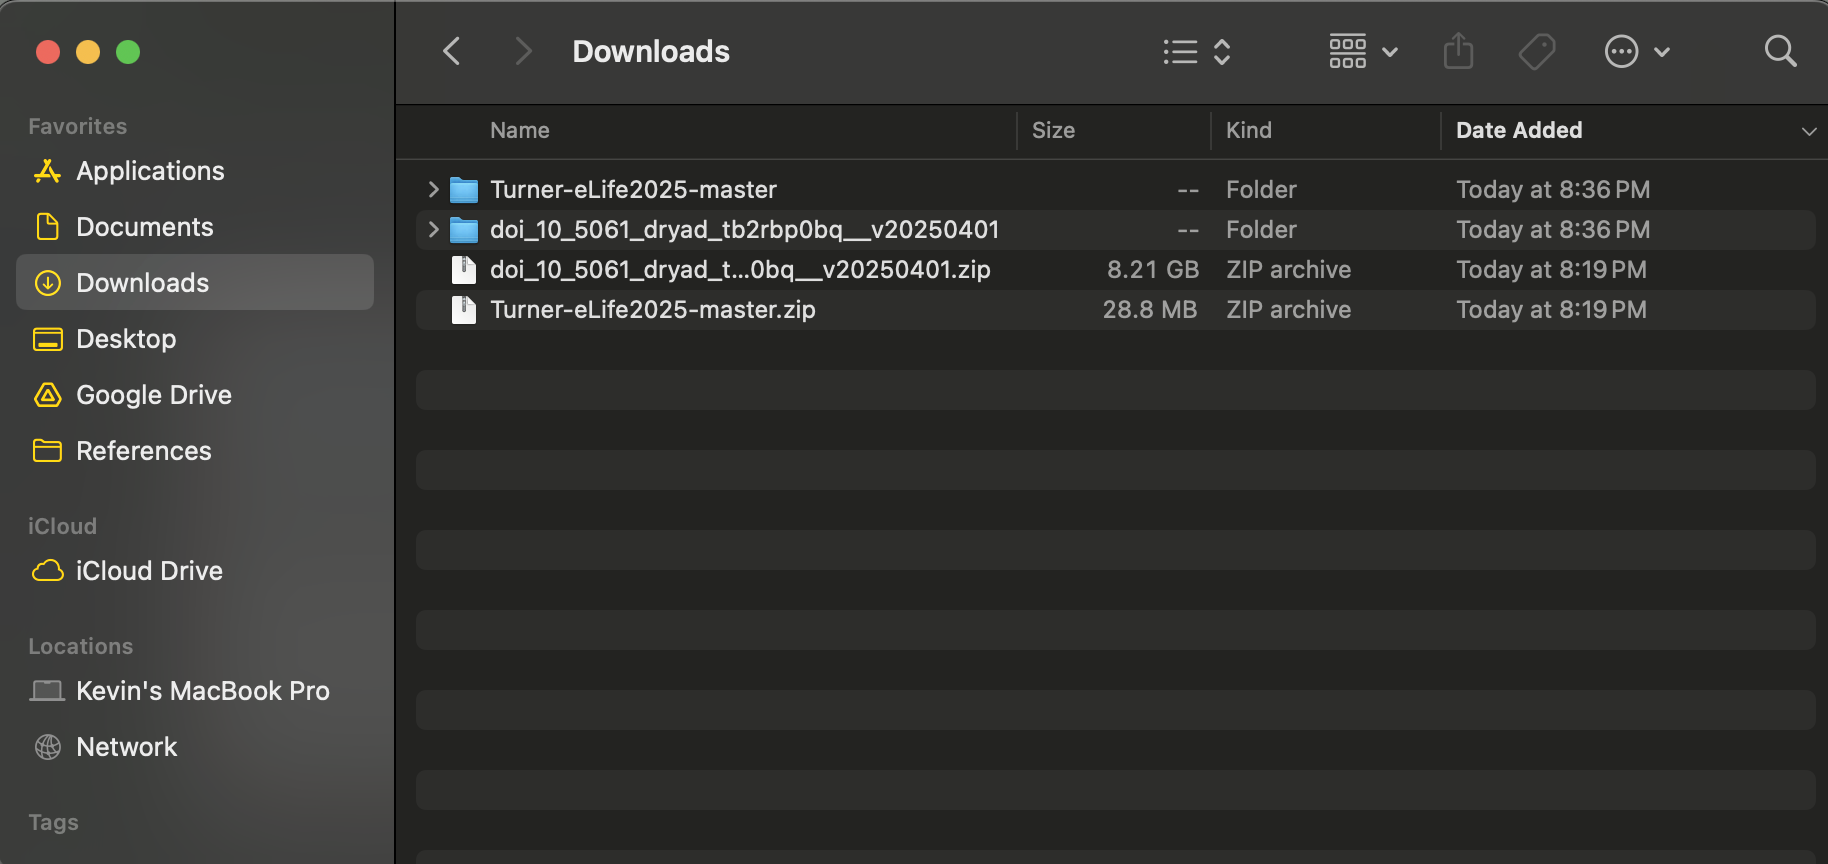
After downloading both the code and data, unzip both folders by right clicking and selecting Extract all or double clicking each folder. The unzipped folders should look something like this.
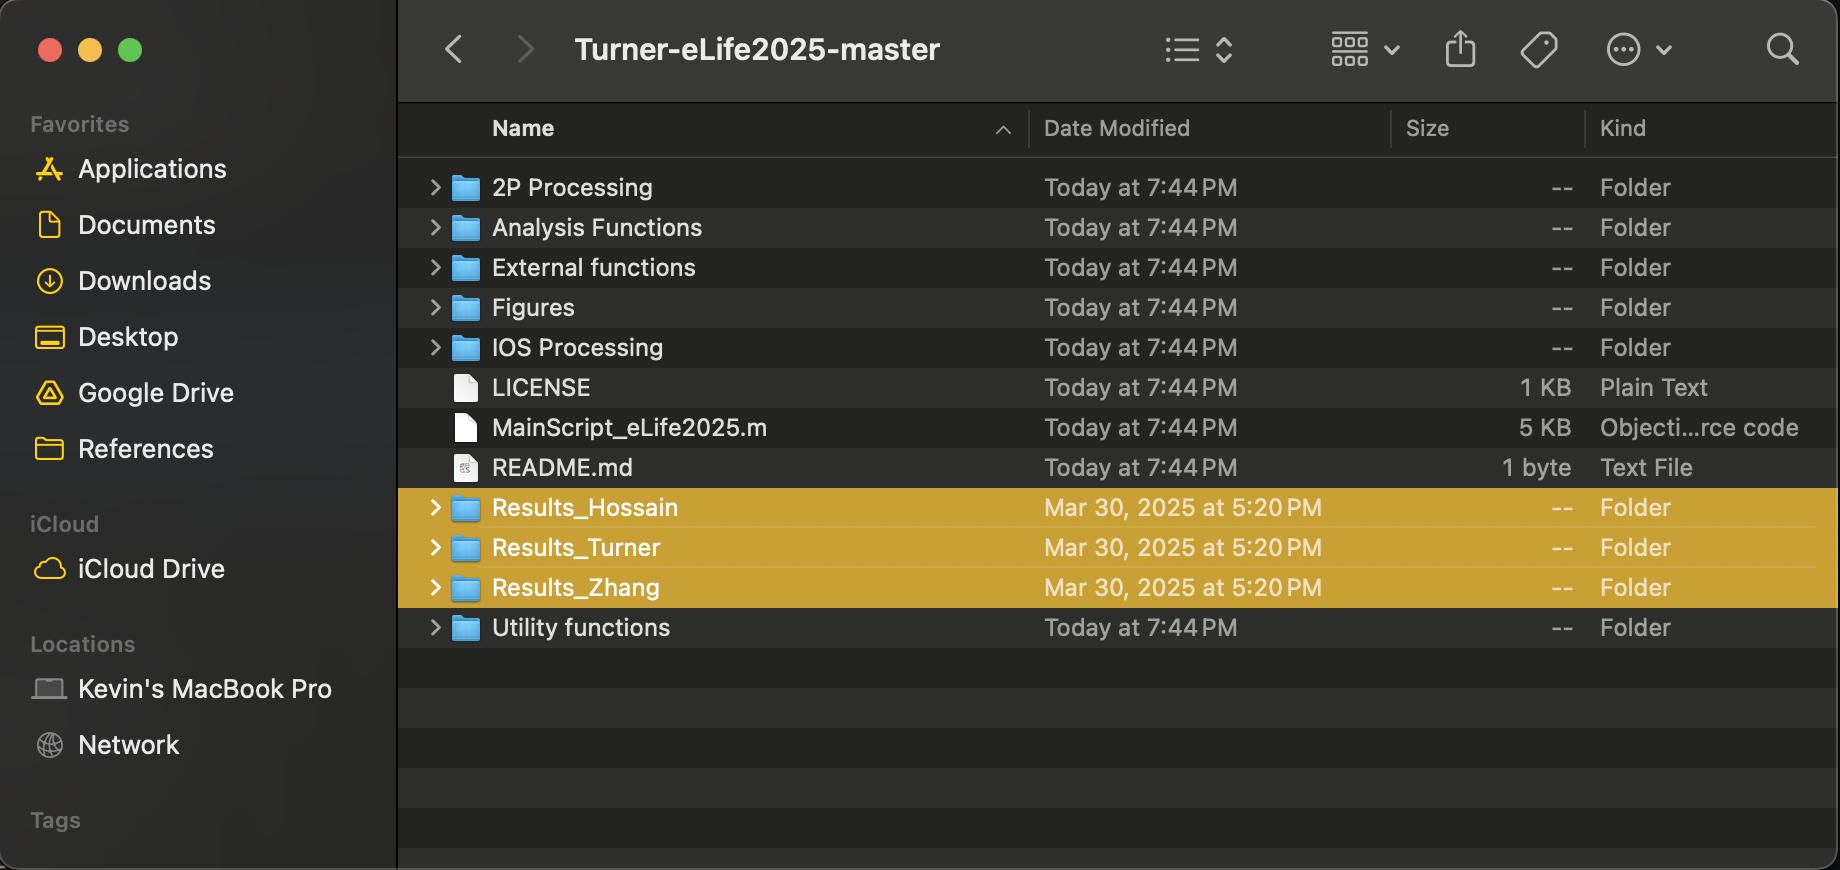
The Dryad link contains several pre-analyzed structures that can be used to immediately generate the figures without re-analyzing any data. To generate the figures, begin by moving all of the files from the unzipped Dryad folder (the Results_ folders) into the code repository. It should look something like this:
The repository includes pre-analyzed structures for each analysis performed in the paper, each of these has the prefix "Results_" followed by the analysis performed. _Ephys, _GCaMP, _Pulse, _2P refers to animals in different data sets depending on experimental configuration.Descriptions of each analysis can be found in the manuscript, and units are consistent with the figures used by each analysis. If short, a description of the data and units is as-follows:
- Results_ArousalStateProb_Ephys.mat - probability (%) of each animal being in a given classification state; Fig. S2
- Results_ArousalStateProb_GCaMP.mat - probability (%) of each animal being in a given classification state; Fig. S2
- Results_Baseline_2P.mat - baseline diameter (μm) of each arteriole; Fig. 7
- Results_BaselineShift_2P.mat - diameter shift (μm) during isoflurane of each arteriole; Fig. 7
- Results_BilatCoher_Ephys.mat - coherence (unitless) between bilateral gamma power (ΔP/P) or HbT (μM); Fig. 6
- Results_BilatCoher_GCaMP.mat - coherence (unitless) between bilateral GCaMP (ΔF/F) or hemodynamics HbT (μM); Fig. 6
- Results_CrossCorr_Ephys.mat - cross correlation (unitless) between hemodynamic HbT (μM) and/or gamma power (ΔP/P); Fig. 5
- Results_CrossCorr_GCaMP.mat - cross correlation (unitless) between HbT (μM) and/or GCaMP (ΔF/F); Fig. 5
- Results_Diameter_2P.mat - arteriole diameter (ΔD/D) during different arousal states; Fig. 7
- Results_Evoked_2P.mat - arteriole diameter (ΔD/D) following vibrissae stimulation; Fig. 3
- Results_Evoked_Ephys.mat - HbT (μM)and gamma power (ΔP/P) following vibrissae stimulation; Fig. 3
- Results_Evoked_GCaMP.mat - HbT (μM) and GCaMP (ΔF/F) following vibrissae stimulation; Fig. 3
- Results_Evoked_Pulse.mat - HbT (μM) following vibrissae stimulation; Fig. 3
- Results_HRF_Ephys.mat - hemodynamic response functions (unitless) between HbT (μM) and gamma power (ΔP/P), Fig. S5
- Results_IntSig_Ephys.mat - intrinsic optical imaging of HbT (μM) data; Fig. 7, Fig. S7
- Results_IntSig_GCaMP.mat - intrinsic optical imaging of HbT (μM) data and GCaMP (ΔF/F); Fig. 7, Fig. S7
- Results_IntSig_Pulse.mat - intrinsic optical imaging of HbT (μM) data; Fig. S6
- Results_ModelAccuracy_Ephys.mat - sleep scoring model accuracy (Awaken, NREM, REM classes) as percentages; Fig. S3
- Results_ModelAccuracy_GCaMP.mat - sleep scoring model accuracy (Awaken, NREM, REM classes) as percentages; Fig. S3
- Results_NeuralHemoCoher_Ephys.mat - coherence (unitless) single hemisphere gamma power (ΔP/P) and HbT (μM); Fig. 5
- Results_NeuralHemoCoher_GCaMP.mat - coherence (unitless) single hemisphere GCaMP (dF/F) and hemodynamics HbT (μM); Fig. 5
- Results_PearsonCorr_Ephys.mat - Pearsons correlation coefficient (unitless) between bilateral HbT (μM) and gamma power (ΔP/P); Fig. S6
- Results_PearsonCorr_GCaMP.mat - Pearsons correlation coefficient (unitless) between bilateral HbT (μM) and GCaMP (ΔF/F); Fig. S6
- Results_PowerSpec_2P.mat - power spectrum (unitless) of arteriole diameters (ΔD/D); Fig. S4
- Results_PowerSpec_Ephys.mat - power spectrum (unitless) of HbT(μM) and gamma power (ΔP/P); Fig. S4
- Results_PowerSpec_GCaMP.mat - power spectrum (unitless) of HbT (μM) and GCaMP (ΔF/F); Fig. S4
- Results_PowerSpec_LFP.mat - power spectrum (unitless) of local field potentials (power, a.u.); Fig. 4
- Results_PupilArea_Ephys.mat - change in pupil size (mm, mm^2) during different arousal states; Fig. S2
- Results_PupilBlinkInterval_Ephys.mat - time between blinking events (seconds); Fig. S2
- Results_PupilEvoked_Ephys.mat - change in pupil size (mm, mm^2) following vibrissae stimulation; Fig. S2
- Results_Transitions_Ephys.mat - change in HbT (μM) and neural activity (power, a.u.) of arousal transitions; Fig. S7
- Results_Transitions_GCaMP.mat - change in HbT (μM) and GCaMP (ΔF/F) of arousal transitions; Fig. S7
- Results_WhiskBehav_Ephys.mat - duration and temporal characteristics of individual whisking events; Fig.S2
- Results_WhiskBehav_GCaMP.mat - duration and temporal characteristics of individual whisking events; Fig.S2
Data sets used for representative examples
- T165_210222_12_45_38_ProcData.mat - hemodynamics, behavior, vibrissae tracking, vibrissae stimulation; (Fig. 2)
- T165_210222_12_45_38_SpecDataA.mat - Spectrograms of neural and hippocampal power; (Fig. 2)
- T165_210223_12_37_03_ProcData.mat - hemodynamics, behavior, vibrissae tracking, vibrissae stimulation; (Fig. 2)
- T165_210223_12_37_03_SpecDataA.mat - Spectrograms of neural and hippocampal power; (Fig. 2)
- T192_RH_210518_11_41_23_005_A08_MergedData.mat - hemodynamics, behavior, vibrissae tracking, vibrissae stimulation; (Fig. 2)
- T192_RH_210518_11_41_23_005_A08_SpecData.mat - Spectrograms of neural and hippocampal power; (Fig. 2)
- T233_220206_13_07_08_ProcData.mat - hemodynamics, behavior, vibrissae tracking, vibrissae stimulation; (Fig. 2)
- T233_220206_13_07_08_SpecDataA.mat - Spectrograms of neural and hippocampal power; (Fig. 2)
- T233_220206_14_10_44_ProcData.mat - hemodynamics, behavior, vibrissae tracking, vibrissae stimulation ; (Fig. 2)
- T233_220206_14_10_44_SpecDataA.mat - Spectrograms of neural and hippocampal power; (Fig. 2)
Immunohistochemistry and Histological characterization data
- DAPI_Counts.xlsx - DAPI IHC cell counts; Fig. 1, Fig. S1
- DAPI_Fluorescence.xlsx - DAPI IHC (fluorescence, a.u.); Fig. 1, Fig. S1
- Diaphorase_Counts.xlsx - NADPH Diaphorase cell counts; Fig. 1, Fig. S1
- GFAP_Fluorescence.xlsx - GFAP IHC (fluorescence, a.u.); Fig. 1, Fig. S1
- IBA1_Counts.xlsx - IBA1 IHC cell counts; Fig. 1, Fig. S1
- MasterMouseList.xlsx - Notes; Fig. 1, Fig. S1
- NeuN_Fluorescence.xlsx - NeuN IHC 9fluorescence, a.u.); Fig. 1, Fig. S1
- nNOS_Counts.xlsx - nNOS IHC cell counts; Fig. 1, Fig. S1
14 Folders corresponding to experimental IDs: T192, T200, T205, T206, T208, T209, T211, T212, T213, T216, T217, T218, T219, T225. Each folder contains the analyzed data from three runs (all .mat structures with name, condition, file date) for spectroscopy experiments HbT, HbO, HbR (μM) during locomotion; Fig 3 Text.
- 55 data sets (AnimalID_Run1.mat or AnimalID_Run1.png) of open-field, exploratory * behavior.
- ExperimentalRecords_Keys.xlsx - summary of animal information, Notes
- OFTTable.mat - Analysis of open field exploratory behavior, position/location analysis of animal within ROI; Fig S2.
From here, open MATLAB and nativate to the code's folder. Open the function MainScript_eLife2025.m. Click the green Run button and the figures will then take a few minutes to generate.
Software/System Requirements: Code was written and tested with MATLAB 2024b. Running MainScript_eLife2025.m took ~5 minutes to run on a 2021 Macbook Pro with M1 Pro chipset and 16 Gb RAM.
The Mainscript will automatically save all of the MATLAB figures and statistical read-outs, which will be saved in a folder called MATLAB Figs & Stats. We are happy to provide any raw data and unprocessed histological images upon request.
LabVIEW code used to acquire the data can be found at: https://github.com/DrewLab/LabVIEW-DAQ
- Chronux Toolbox: http://chronux.org/
- ConvertTDMS.m by Brad Humphreys: https://github.com/humphreysb/ConvertTDMS
- colors.m by John Kitchin: http://matlab.cheme.cmu.edu/cmu-matlab-package.html
- BrainMesh.m by Yaoyao Hao: https://github.com/Yaoyao-Hao/BrainMesh
- multiWaitbar.m by Ben Tordoff: https://www.mathworks.com/matlabcentral/fileexchange/26589-multiwaitbar-label-varargin