This repository contains a data analysis portfolio project for Ben's Pizzeria, a new takeout and delivery pizzeria. The project includes three dashboards that visualize key business metrics, including order activity, inventory management, and staff costs.
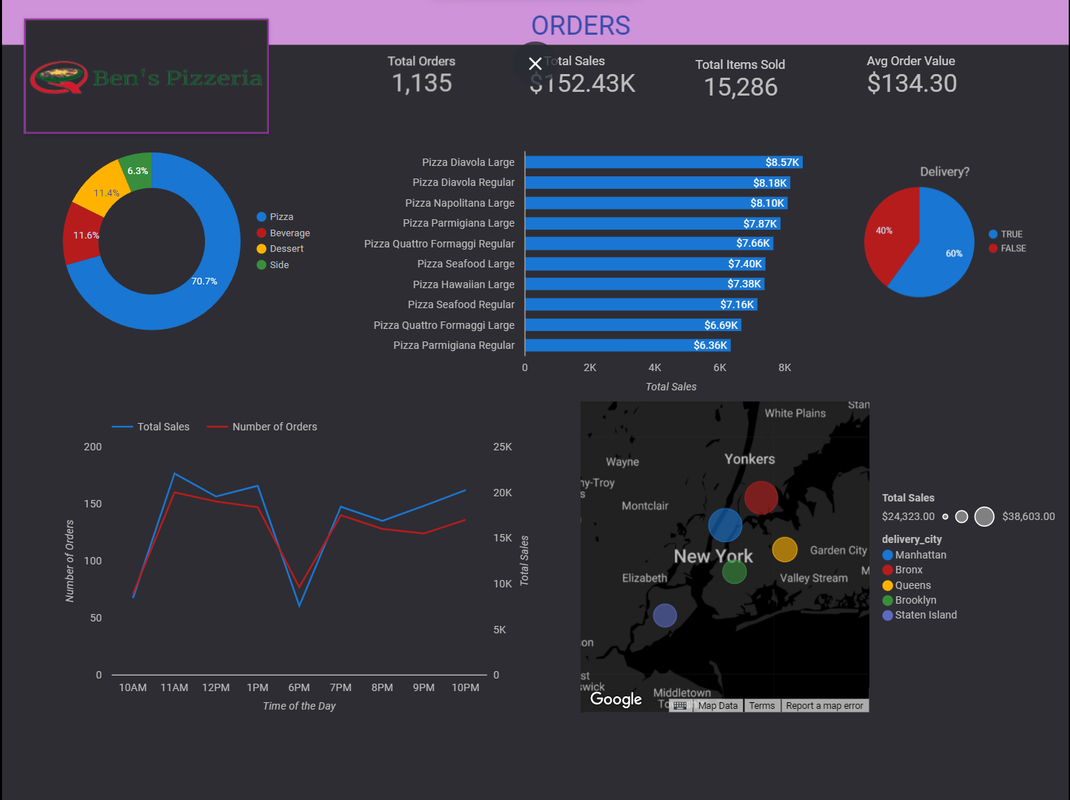
This dashboard provides insights into order trends, such as total orders, sales, items, average order value, sales by category, top-selling items, orders by the hour, sales by hour, orders by address, and orders by delivery/pick-up.
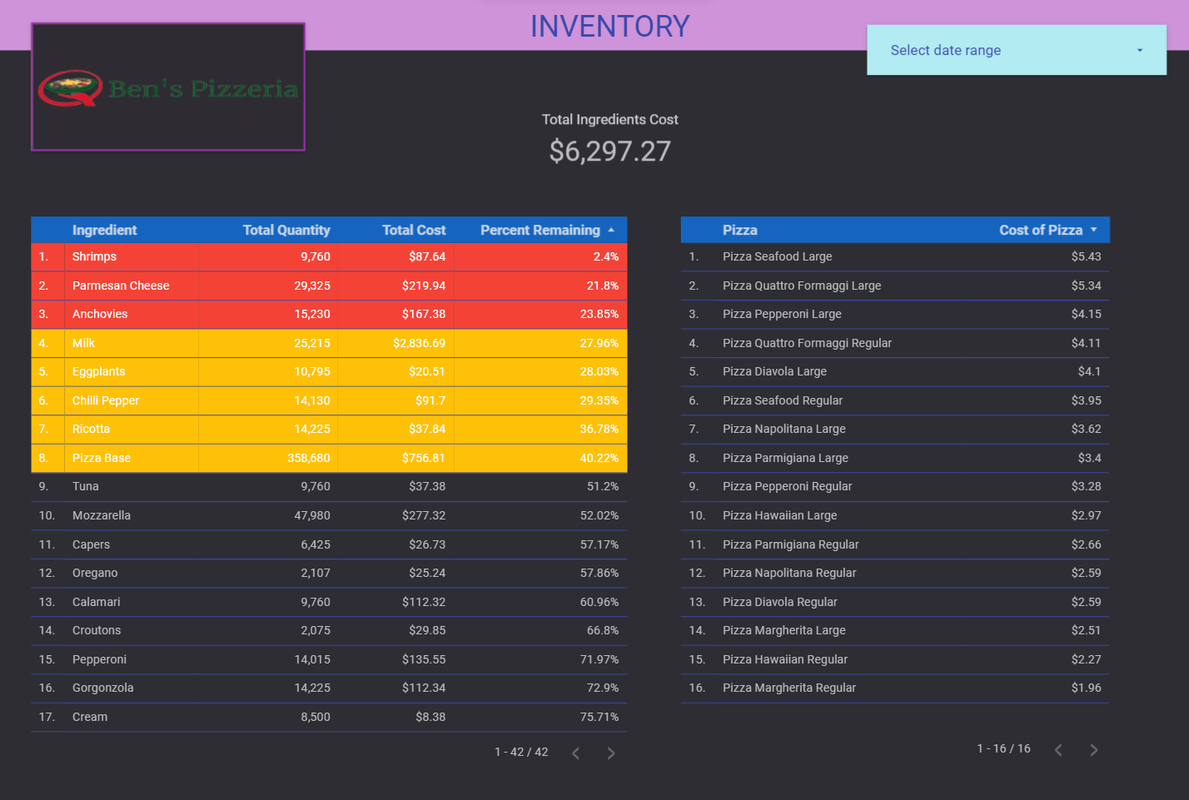
This dashboard tracks inventory usage and costs, as well as the calculated cost of pizzas. It also shows the percentage of stock remaining for each ingredient.
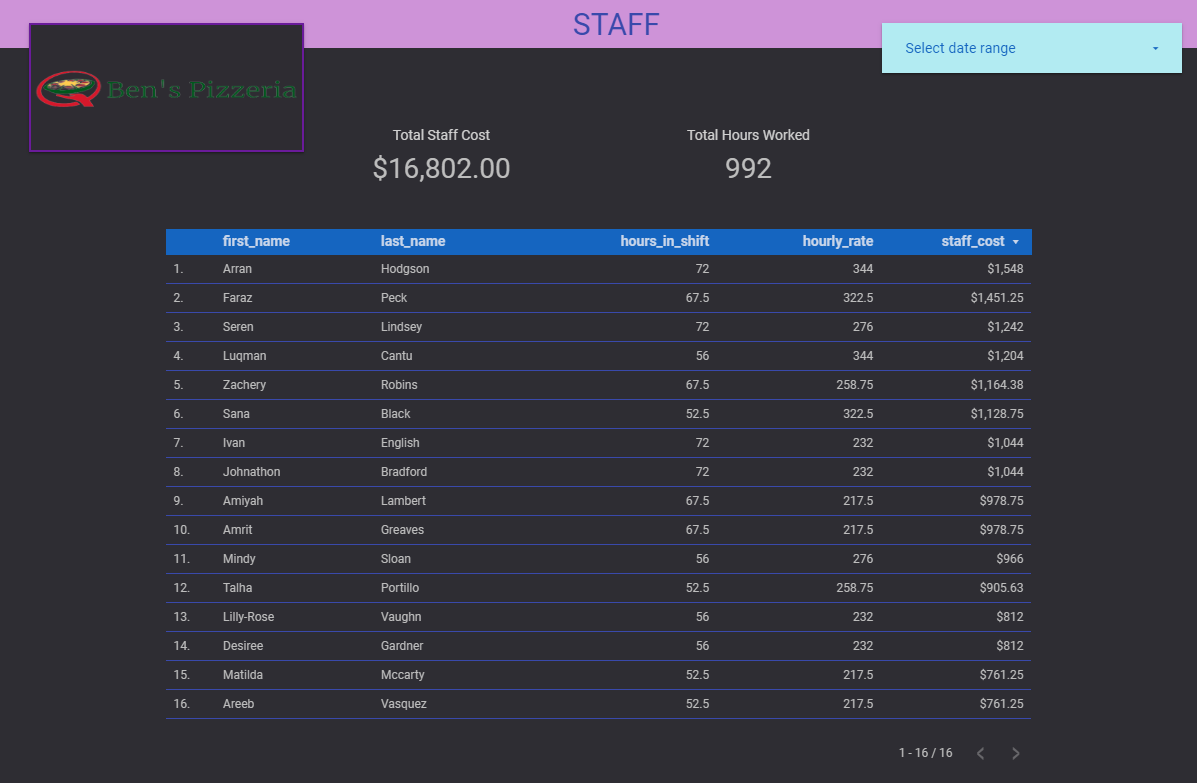
This dashboard monitors staff costs, hours worked, and the cost per staff member.
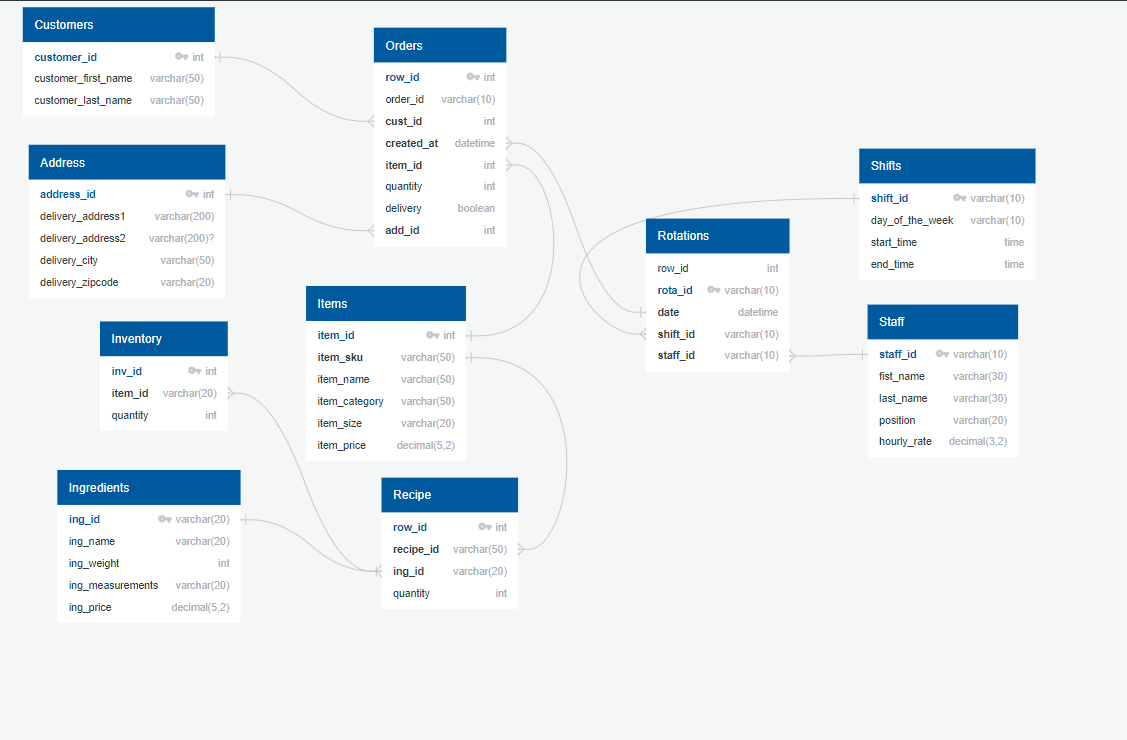
The dashboards were created using Microsoft SQL Server and Google Looker Studio. The data was generated using Mockaroo.com and imported into SQL Server using Microsoft Excel. The database schema was designed using QuickDBD.com.
The dashboards provide Ben with valuable insights into his business performance. He can use these insights to make informed decisions about things like pricing, staffing, and inventory management.
This data analyst portfolio project demonstrates the ability to design a relational database, develop SQL queries to analyze the data and create dashboards to visualize the insights. The project can be used as a template for other data analysts working on similar projects.
Access the Dashboard Report