This is a simulation of the Founders Edition 5090 Nvidia GPU:
The GPU cooling simulation domain includes the following major components:
| Continua | Type | Density (kg/m³) | Specific Heat (J/kg·K) | Thermal Conductivity (W/m·K) | Notes |
|---|---|---|---|---|---|
| Fluid Volume | Fluid | 1.18 | 1003.62 | 0.026 | Air domain for conjugate heat transfer (CHT) |
| PCB | Solid | 1800.0 | 1100.0 | 0.5 | Represents PCB substrate (low-conductivity composite) |
| Die | Solid | 2330.0 | 700.0 | 130.0 | Silicon die with high thermal conductivity |
| Vapor Chamber | Solid | 8800.0 | 400.0 | Orthotropic: 20,000 (axial and traverse), 1500 (Radial) | vapor chamber with embedded heat pipes |
The GPU cooling simulation domain includes the following major regions:
| Region / Part | Type | Notes |
|---|---|---|
| Case | Fluid | Fluid Region Mass flow at the bottom pressure outlet at the top |
| PCB | Solid | PCB substrate (low-conductivity composite) |
| Die | Solid | Silicon die (high thermal conductivity) |
| Vapor Chamber | Solid | Orthotropic: first attemps: 12,000 W/m·K (axial and vertical off the Die), 150 W/m·K perpendicular to the heat pipes(runaway die temps) updated to values states above. (difficult to find accurate values for VC TK) |
| Fan 1 / Fan 2 | Overset | Rotating meshes with Rigid Body Motion (RBM) applied |
Porosity: 0.667
Orthotropic Inertial Resistance:
- xx: 10,000.0 kg/m⁴
- yy: 300.0 kg/m⁴
- zz: 500.0 kg/m⁴
Orthotropic Viscous Resistance:
- xx: 10,000.0 kg/m³·s
- yy: 250.0 kg/m³·s
- zz: 500.0 kg/m³·s
Thermal Conductivity (Orthotropic):
- xx: 0.026 W/m·K
- yy, 237.0 W/m·K
- zz, 237.0 W/m-k
Case
- sides set to walls with convection of 25 w/m^2-K
- inlet at the bottom set to mass flow of 0.088 kg/s
- Pressure outlet at the top
- First test run to ensure thermals and fans are spinning
- Flow through porous medium working
- Heat transfer through all solids working as intended
Notes:
- The conjugate heat transfer (CHT) interface couples the die, vapor chamber, heat sink, and air regions.
- Fans are represented as rotating reference frames (MRF) or rigid-body motion (RBM) zones depending on simulation setup (both cases were sim'ed).
- The heat sink is treated as a porous region to account for detailed fin flow resistance while retaining conjugate heat transfer effects.
- The vapor chamber is modeled as an orthotropic solid to represent the high in-plane heat spreading provided by the embedded wick and vapor core. In detailed simulations, a true vapor chamber is often represented by a five-layer structure (top cover, top wick, vapor core, bottom wick, and bottom cover) to capture phase-change and capillary effects. For demonstration purposes, this model simplifies the vapor chamber into a single anisotropic solid block with equivalent thermal properties and can be off by as much as 10%-15%. For this demonstation, 20,000 W/m-k is conservative as the effective thermal conductivity can be as high as 40,000 W/m-k
Below are views of the GPU simulation mesh:


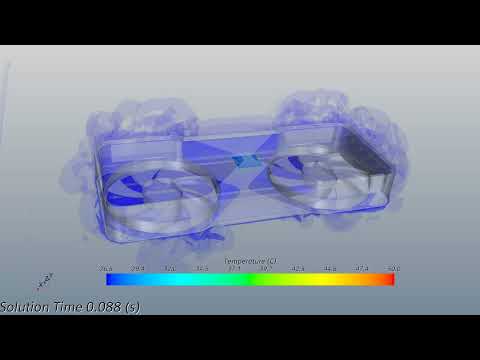
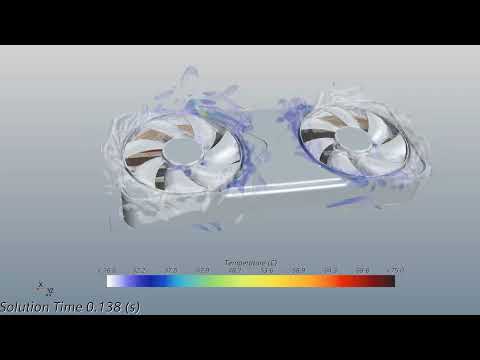
- This visualization models transient conjugate heat transfer through the RTX 5090 FE under a 600 W thermal load. The GPU die receives 450 W, and the PCB receives 150 W (future project would actually model the memory modules).
- Dual fans are simulated with Rigid Body Motion (RBM) to generate realistic airflow and convection through the porous heat-sink region.
- The simulation captures full heat transfer across the die, vapor chamber, heat sink, and PCB.

Inlet Static Pressure: ~10 Pa (average)
Outlet Static Pressure: ~-0.4 Pa (average)
Pressure Drop: ΔP ≈ 10.4 Pa


The pressure drop across the heatsink assembly is approximately 10.4 Pa, which is relatively low for a GPU cooling solution. This indicates:
- Significant flow bypass around the porous media
- Dead zones with stagnant air contributing to reduced effective flow area
- Volume-averaged velocity through fins: 0.515 m/s
- Velocity in active flow regions: ~1.5 m/s
- Estimated effective fin utilization: ~35%
This significant discrepancy between local and average velocities reveals that approximately 2/3 of the fin area experiences poor or stagnant flow.
The video below shows the blockage from the dead zone closer to center as well as from the heat pipes:
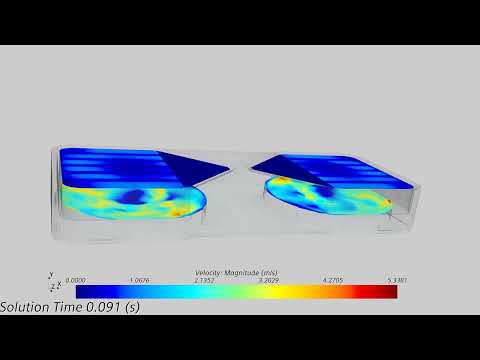
Inlet Temperature: ~70°C (average)
Outlet Temperature: ~64°C (average)
Temperature Change: ΔT ≈ -6°C


-Die Temperature stablizes at 87°C
The counterintuitive temperature drop (inlet hotter than outlet) is from the cooling architecture. This occurs due to:
- Flow stagnation zones where air becomes trapped with poor flow through
- Non-uniform flow distribution through the porous media
- Hot pockets forming in blocked regions

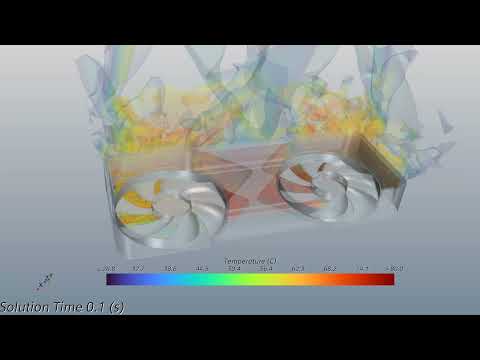
The temperature contour shows:
- Non-uniform thermal distribution across the heatsink
- Hot spots correlating with dead flow zones
With only ~35% of the fin area receiving adequate airflow (1.5 m/s in active regions vs 0.515 m/s average), there are parts of the heatsink mass that is underutilized, creating localized thermal buildup and reducing overall cooling efficiency.
Notes:
- Simulated temperatures run ~10 °C higher than public benchmarks. Likely causes include conservative boundary conditions, approximate material properties, and simplified contact resistances.
- Geometry fidelity: Accurate geometry available for fins, fans, enclosure. Vapor chamber/heat pipes (may not perfectly match FE dimensions). GPU die and PCB geometry are estimated from teardown references and simplified to 2 parts.
- Power mapping: 450 W die / 150 W board used as a first-order split. With detailed PCB and package geometry, power would be allocated per component (die, VRAM packages, VRM stages) with appropriate surface fluxes and contact conductance.
- Radiation was also modeled on a steady-state simulation using MRF for the fans with no measurable change in die temperatures