The election commission has requested data for voter turnout by country, the percentage of votes from each county out of the total count and the county with the highest turnout data.
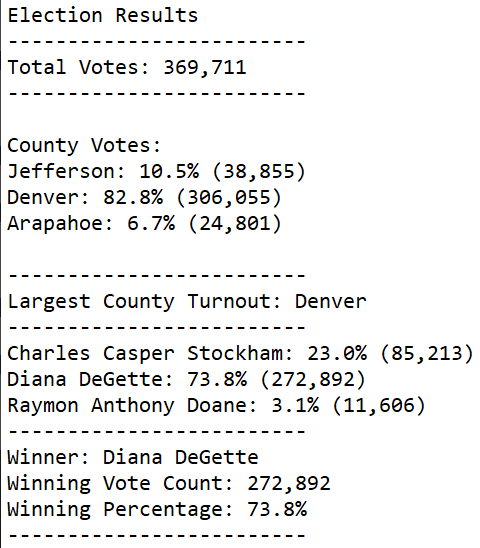
-How many votes were cast in this congressional election? There were 369,711 Total Votes cast in this congressional election.
-Provide a breakdown of the number of votes and the percentage of total votes for each county in the precinct. Jefferson: 10.5% (38,855) Denver: 82.8% (306,055) Arapahoe: 6.7% (24,801)
-Which county had the largest number of votes? Denver had the largest number of votes.
-Provide a breakdown of the number of votes and the percentage of the total votes each candidate received. Charles Casper Stockham: 23.0% (85,213) Diana DeGette: 73.8% (272,892) Raymon Anthony Doane: 3.1% (11,606)
-Which candidate won the election, what was their vote count, and what was their percentage of the total votes? Diana DeGette won the election with 272,892 Votes and a Winning Percentage of 73.8%.
This script can be used for any election with a few minor modifications. First, data should be collected and consolidated in the Excel CSV file with the same columns and format (Ballot ID, County, Candidate). Next, once the information is ready to be evaluated it should be saved over the top of the last election_results.csv file and the Python Script should be run. Keep in mind it might be worthwhile to save a copy of each election_results.csv with the date of the election added to the file name for backup purposes.