A Drizzle ORM-first semantic layer for type-safe analytics
Build a semantic layer on top of your Drizzle schema. Define cubes with measures, dimensions, and joins—then query them from dashboards, AI agents, or your own code. All with full TypeScript inference and SQL injection protection.

A semantic layer sits between your database and your applications. It provides:
- Business-friendly abstractions - Define "Revenue" once, use it everywhere
- Consistent metrics - Everyone uses the same calculation for "Active Users"
- Security isolation - Multi-tenant filtering built into every query
- Self-service analytics - Users explore data without writing SQL
- Decoupling - Reports and AI agents continue to work when you change your underlying data model
Drizzle Cube brings this to the Drizzle ORM ecosystem with full type safety.
| Feature | Drizzle Cube | Raw SQL | Other BI Tools |
|---|---|---|---|
| Type Safety | Full TypeScript inference | Manual types | None |
| SQL Injection | Impossible (parameterized) | Risk | Varies |
| Multi-tenant | Built-in security context | Manual | Complex |
| AI Integration | MCP server included | Build yourself | Limited |
| Setup | Minutes | Hours | Days |
npm install drizzle-cube drizzle-ormimport { defineCube } from 'drizzle-cube/server'
import { eq } from 'drizzle-orm'
import { employees, departments } from './schema'
export const employeesCube = defineCube('Employees', {
// Security: filter by organisation automatically
sql: (ctx) => ({
from: employees,
where: eq(employees.organisationId, ctx.securityContext.organisationId)
}),
// Define relationships for cross-cube queries
joins: {
Departments: {
targetCube: () => departmentsCube,
relationship: 'belongsTo',
on: [{ source: employees.departmentId, target: departments.id }]
}
},
measures: {
count: { type: 'count', sql: employees.id },
avgSalary: { type: 'avg', sql: employees.salary },
totalSalary: { type: 'sum', sql: employees.salary }
},
dimensions: {
name: { type: 'string', sql: employees.name },
email: { type: 'string', sql: employees.email },
hiredAt: { type: 'time', sql: employees.hiredAt }
}
})import { Hono } from 'hono'
import { createCubeApp } from 'drizzle-cube/adapters/hono'
import { employeesCube, departmentsCube } from './cubes'
const app = createCubeApp({
cubes: [employeesCube, departmentsCube],
drizzle: db,
schema,
getSecurityContext: async (req) => ({
organisationId: req.user.orgId // Multi-tenant isolation
})
})
export default app// From React components
import { AnalysisBuilder, AnalyticsDashboard } from 'drizzle-cube/client'
// From AI agents via MCP
// Connect Claude, ChatGPT, or n8n to /mcp
// From your own code
const result = await fetch('/cubejs-api/v1/load', {
method: 'POST',
body: JSON.stringify({
query: {
measures: ['Employees.count', 'Employees.avgSalary'],
dimensions: ['Departments.name']
}
})
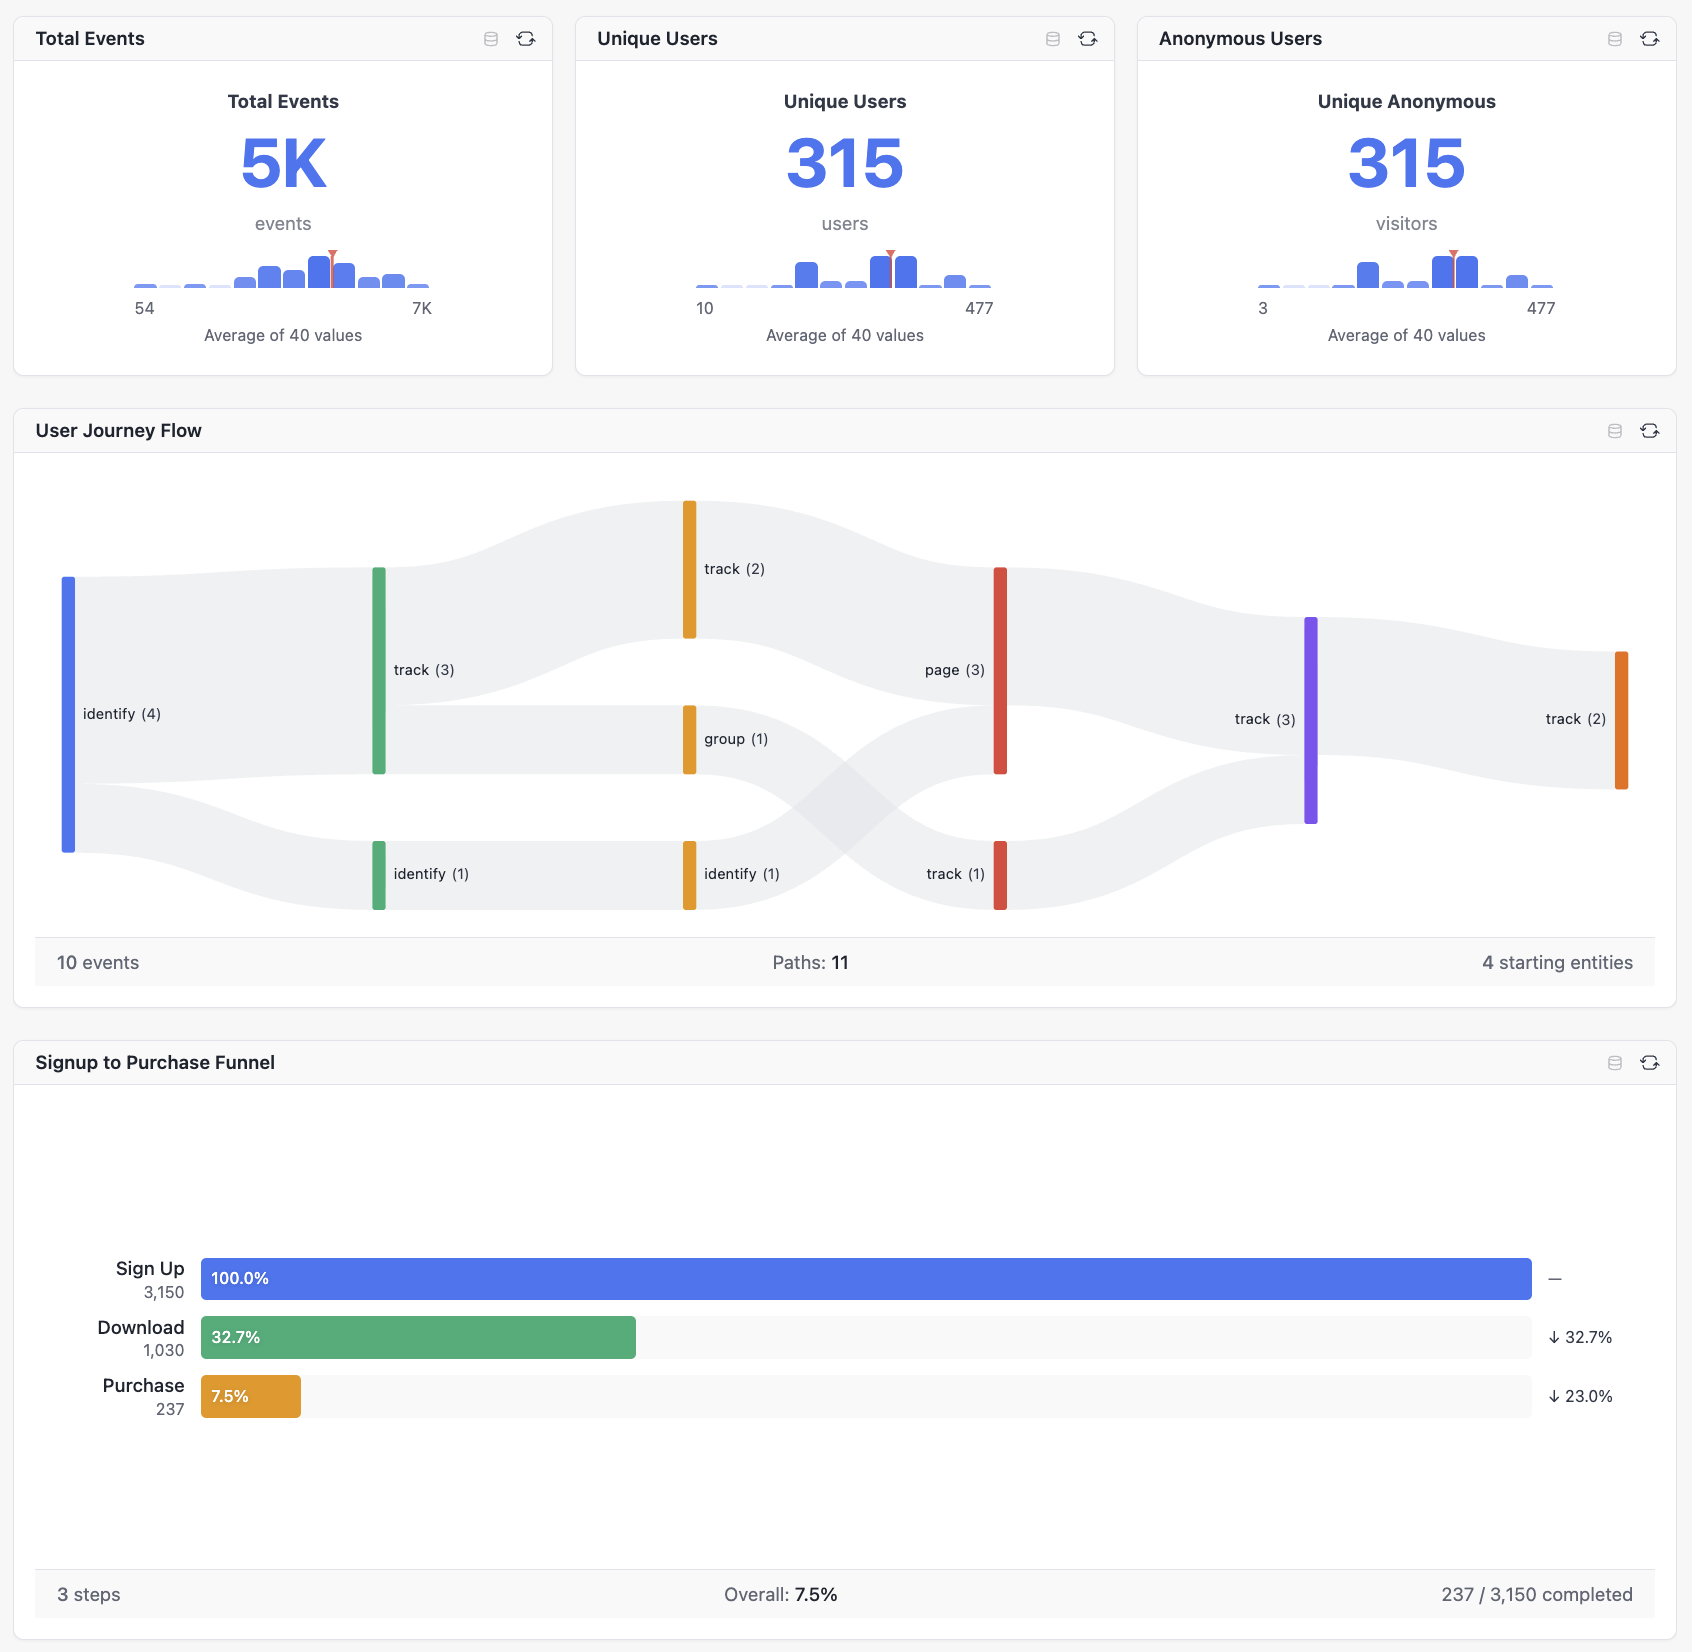
})Drizzle Cube supports multiple analysis modes out of the box:
Build ad-hoc queries with measures, dimensions, filters, and time ranges. Search-first field picker, drag-and-drop chart configuration, and multiple visualization options.
Track conversion through multi-step processes. Define funnel steps, measure drop-off rates, and analyze time-to-convert metrics (average, median, p90).
// Funnel query example
{
  analysisType: 'funnel',
  steps: [
    { name: 'Signed Up', filter: { member: 'Users.status', operator: 'equals', values: ['registered'] } },
    { name: 'Activated', filter: { member: 'Users.activated', operator: 'equals', values: [true] } },
    { name: 'Subscribed', filter: { member: 'Users.plan', operator: 'notEquals', values: ['free'] } }
  ],
  timeDimension: 'Users.createdAt',
  dateRange: ['2024-01-01', '2024-12-31']
}Visualize user journeys and navigation paths through your application. Understand how users move between states or pages.
Measure user retention over time with cohort analysis. Track how many users return after their first interaction across days, weeks, or months.
Compose multiple charts into persistent dashboards with grid layouts, filters, and real-time updates. Save and share dashboard configurations.
Drizzle Cube includes a built-in MCP server that lets AI agents query your semantic layer:
| Tool | Purpose |
|---|---|
drizzle_cube_discover |
Find relevant cubes by topic |
drizzle_cube_validate |
Validate queries with auto-corrections |
drizzle_cube_load |
Execute queries |
Claude Desktop - Add to claude_desktop_config.json:
{
  "mcpServers": {
    "analytics": {
      "command": "npx",
      "args": ["-y", "@anthropic/mcp-remote", "https://your-app.com/mcp"]
    }
  }
}
Claude.ai - Settings → Connectors → Add your MCP URL
ChatGPT - Settings → Connectors → Developer Mode → Add MCP URL
n8n - Use the MCP Client node in your workflows
Learn more about AI integration →
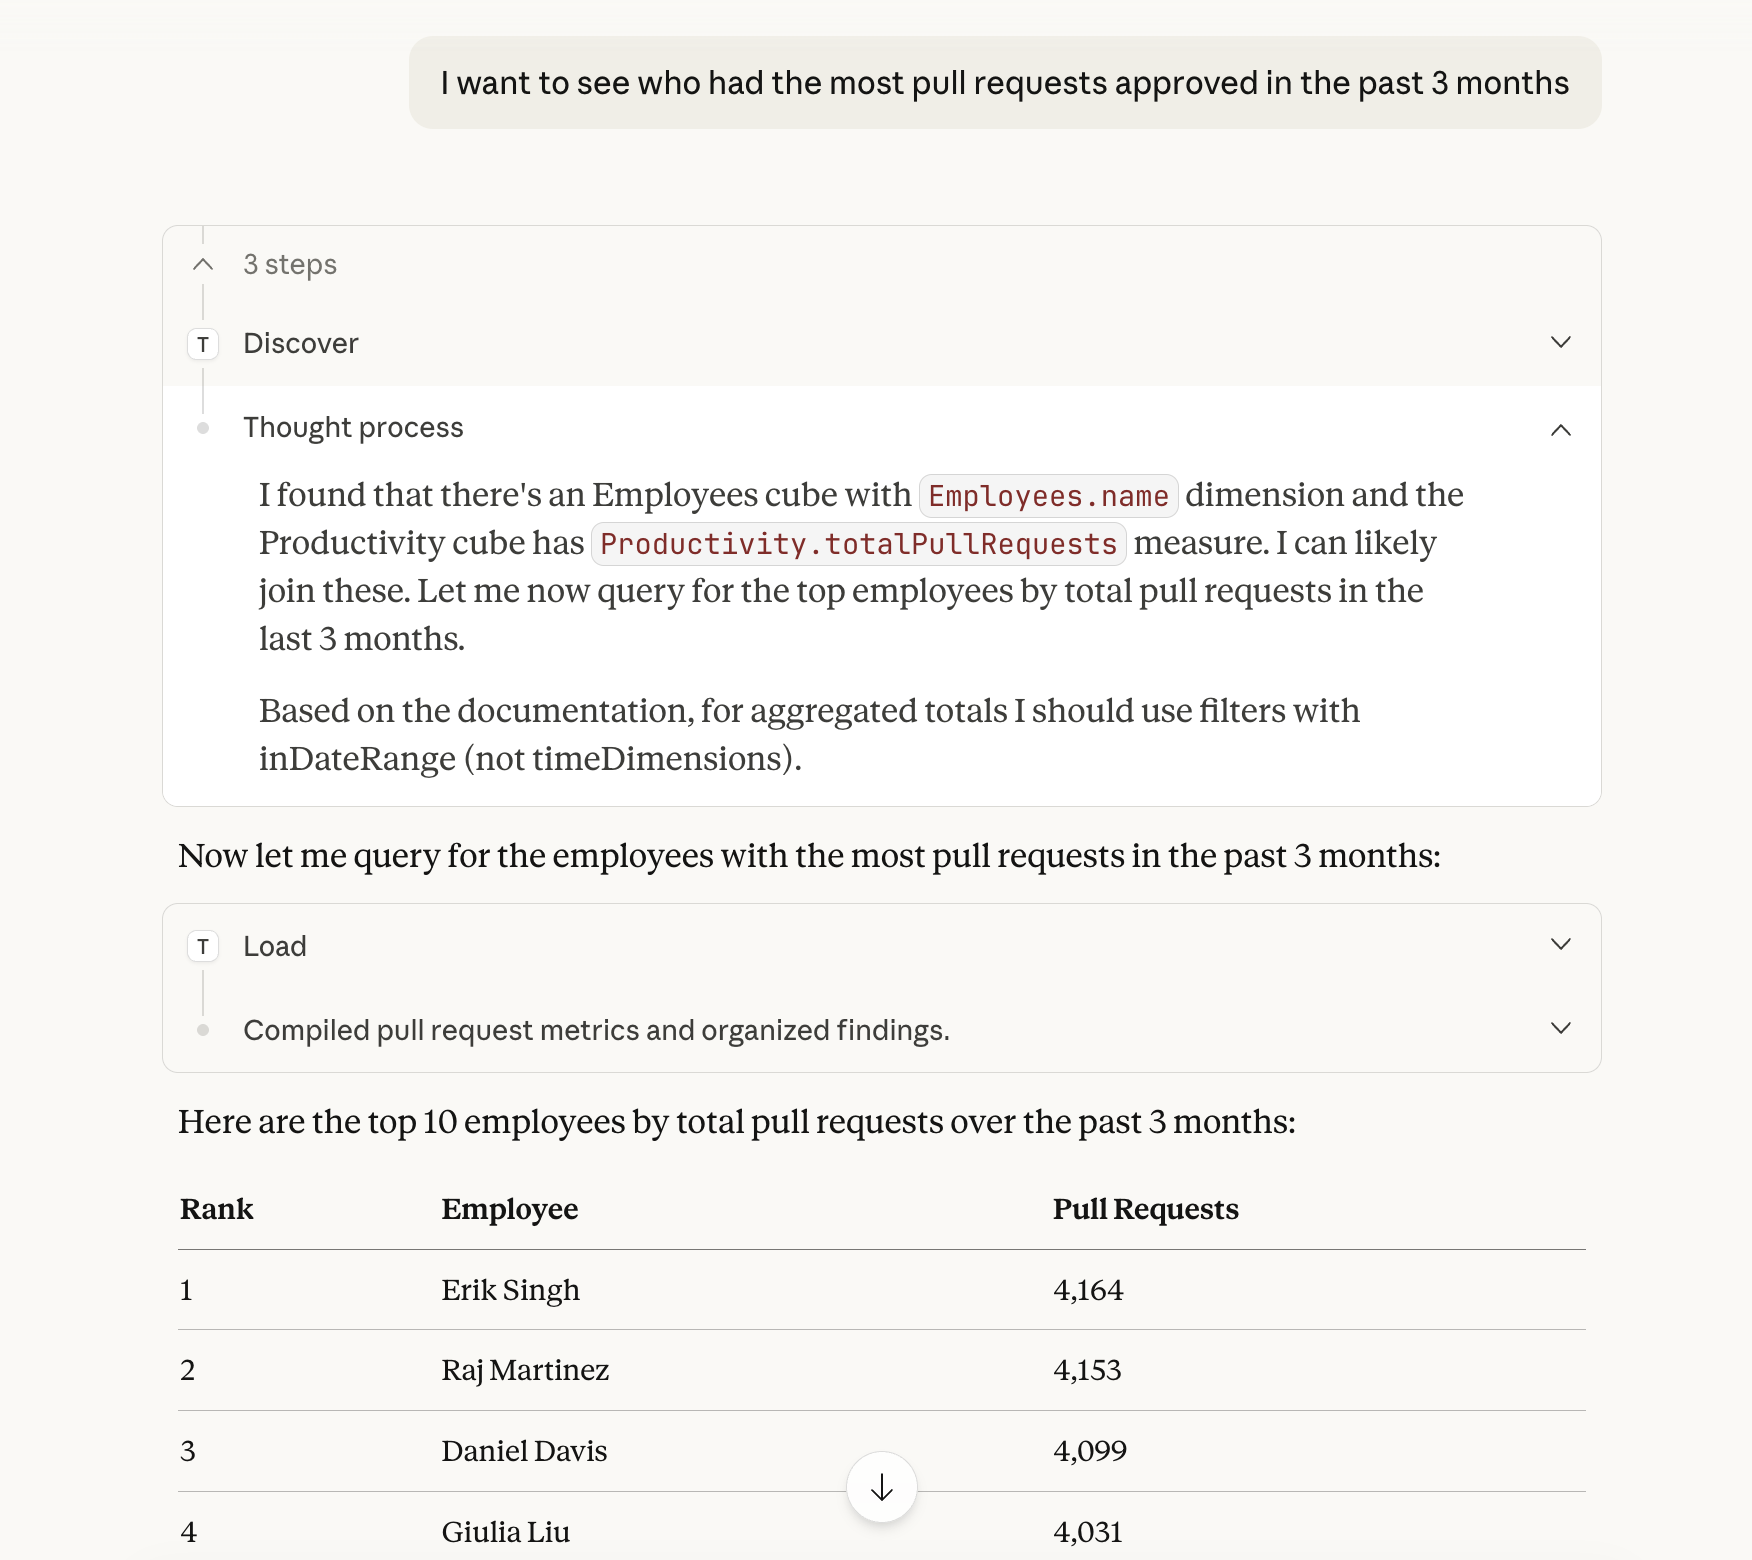
Query your semantic layer with natural language directly from Claude Code:
claude /install-plugin github:cliftonc/drizzle-cube-pluginThen configure your API endpoint in .drizzle-cube.json and ask Claude things like:
- "Show me revenue by region for the last quarter"
- "Which departments have the highest average salary?"
- "Create a dashboard showing key HR metrics"
- Cubes - Define measures, dimensions, and calculated fields
- Joins - belongsTo, hasOne, hasMany, belongsToMany relationships
- Security - Multi-tenant isolation via security context
- Cross-cube queries - Automatic join resolution
- AnalysisBuilder - Interactive query builder with chart visualization
- AnalyticsDashboard - Configurable dashboards with grid layouts
- Chart components - Bar, line, area, pie, funnel, heatmap, and more
- Express, Fastify, Hono, Next.js adapters
- PostgreSQL, MySQL, SQLite, DuckDB databases
- React components with TanStack Query
Three built-in themes (light, dark, neon) with semantic CSS variables. Add custom themes without changing components.
- Getting Started - Installation and setup
- Semantic Layer - Cubes, measures, dimensions, joins
- Client Components - React components and hooks
- AI Integration - MCP server and Claude plugin
- API Reference - Complete API documentation
- Hono Example - Cloudflare Workers compatible
- Express Example - Traditional Node.js server
- Fastify Example - High-performance server
- Next.js Example - Full-stack React
We welcome contributions! Please see our Contributing Guide.
View and contribute to the roadmap on GitHub Projects.
MIT © Clifton Cunningham
Built with ❤️ for the Drizzle ORM community