a python package to plot results from eggnog-mapper and calculate correlations
egger can plot COG functional annotations from eggnog-mapper annotation files.
The repository for eggnog-mapper can be found, here.
It has two modes:
compare: compares the correlation of COG categories across several genomes.window: plots sliding window plots of COG category distribution across a genome.
See below for usage examples.
You can install egger with pip.
Either use the PyPI installation: pip install egger.
Or, clone this repository and install manually.
egger only requires Python dependencies, which should be installed automatically.
As described above, egger has two modes:
egger compare will calculate the correlation of COG category annotations across genomes and build a dendrogram-heatmap.
It will write this as .svg file along with the raw data in .tsv formats. It can perform Spearman's rank (-s) or Pearson's (-p) correlation.
It can also produce barcharts (-b). Use: egger compare -h for more information.
Here is an example using this repository's example_data/outputs/compare_outputs as the working directory:
$ egger compare -b barchart -s spearmans -p pearsons ../../inputs/annotations/*
These heatmaps can help identify relationships between genomes or other sequences.

egger window will take eggnog-mapper annotations and plot them using a sliding window.
Please note, as eggnog-mapper annotations do not contain location data, the original genome used for the analysis is also required.
You will also need to define outputs with -swo or -swp. You can also modify the window and step size using. Use: egger window -h for more information.
Here is an example using this repository's example_data/outputs/window_outputs as the working directory:
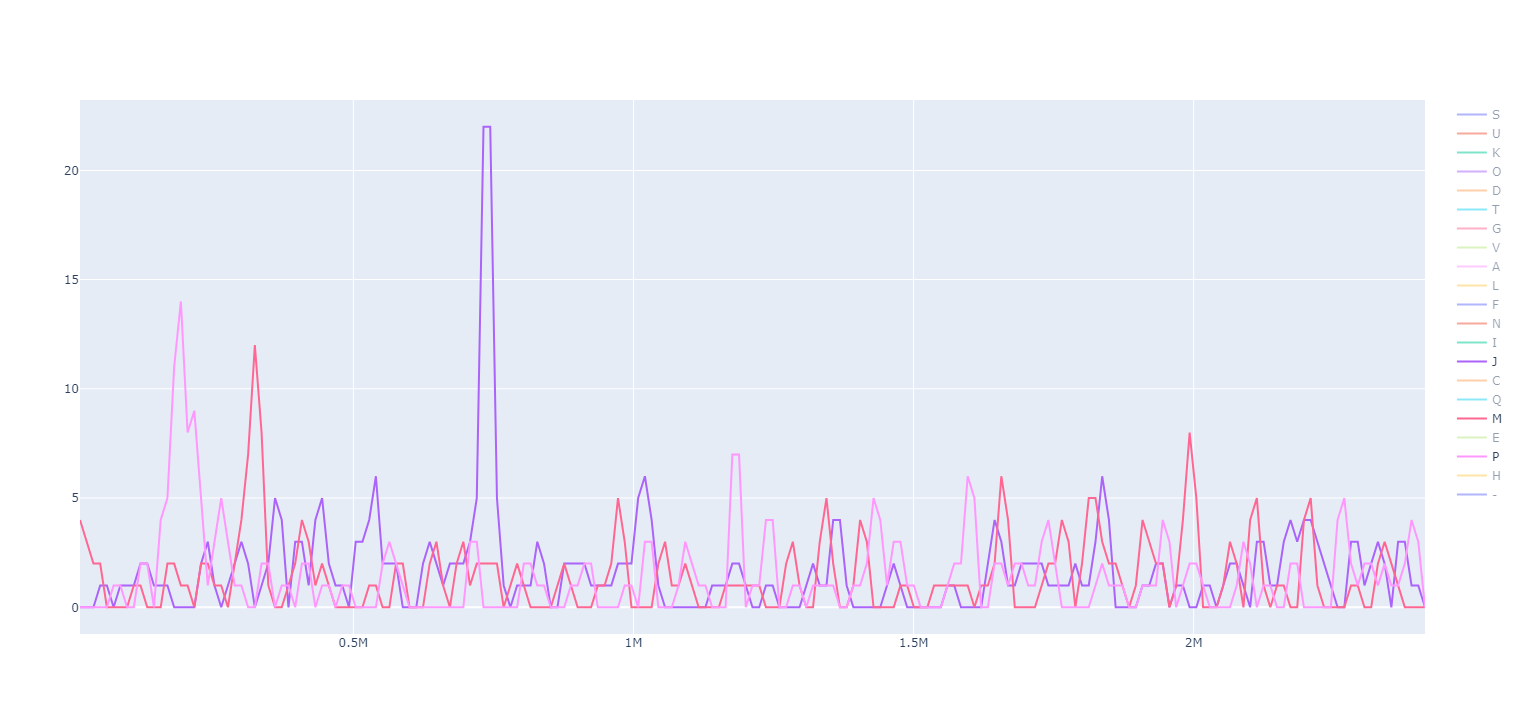
egger window -a ../../inputs/annotations/Lactococcus_lactis.annotations -g ../../inputs/genomes/Lactococcus_lactis.gb -swo output_ -swp plot_
This will produce two files:
-swowrites a .tsv file with the raw data used for plotting the sliding window.-swpwrites a .html file for an interactive plot of the sliding window data.
This analysis is particularly useful for finding regions of the genome that are dedicated to a specific function. In the example, Lactococcus lactis has three notable islands for the COG categories J, M and P (among others).
If you use egger, please cite:
Gomez-Escribano, J. P., Dorai-Raj, S., Baker, D., Lacey, E., Wilkinson, B. and Booth, T. J. Evidence supporting the first secondary chromosome in actinobacteria as a hallmark of the Embleya genus. BioRxiv (2025). DOI: https://doi.org/10.1101/2025.07.03.662523
- v1.0.0
- Initial version
- v1.0.1
- Updated parser text
- Upated input parsing to accept wildcards