- Install python 3. (tested on versions 3.9, 3.10 and 3.11 on mac/windows)
- To download the latest version of this script, select the release on the right sidebar and download the latest release.
- Extract the folder to a convenient location.
- Recommended: to install all required packages, witin the extracted folder, right click on
setup.pyand select "launch with python launcher".
- Alternatively, required packages can also be installed inidivudally:
- pandas (install command:
pip install pandas) - msoffcypto (install command:
pip install msoffcrypto-tool) - streamlit (install command:
pip install streamlit) - plotly (install command:
pip install plotly) - tkinter (install command:
pip install tk) - PySimpleGUI (install command:
pip install pysimplegui)
- to run the script:
- Right click on the
asp_analytics.gui.pyfile and launch with python launcher
OR enterpython3 asp_analytics_gui.pyin terminal (mac) or cmd (windows)
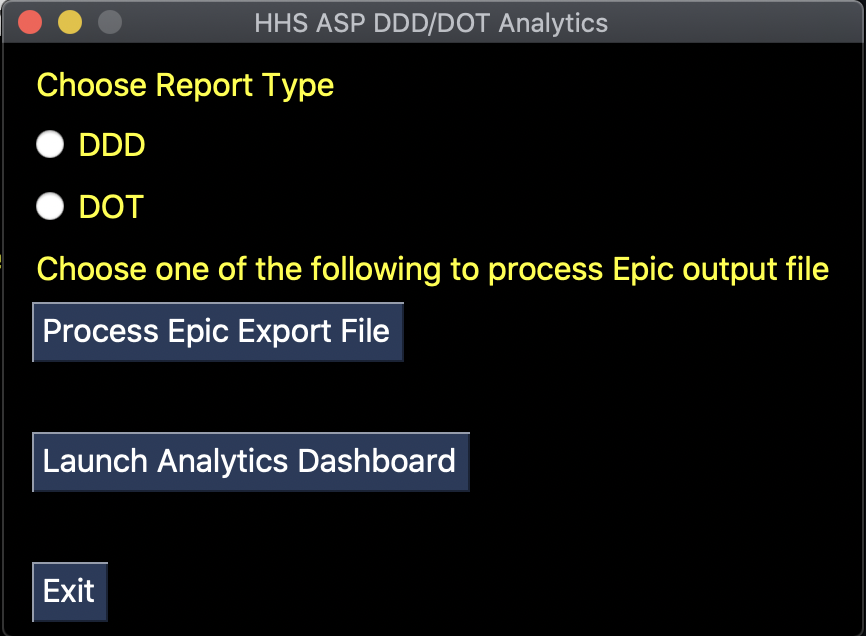
- Process Epic exported file
- First select either the exported report are
DDDorDOT. - Then click on "Process Epic Export File"
- First select either the exported report are
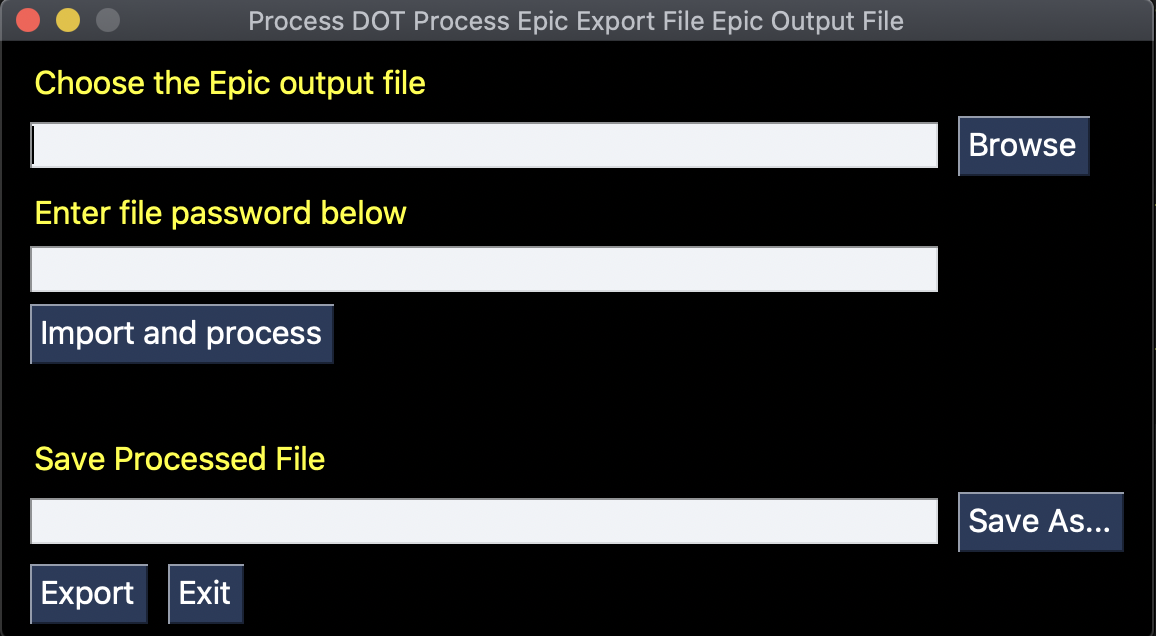
- To select the Epic output file using
Browse, enter the file password- then click
Import and Process - once finished, click
Save Asto enter the desired output name and then clickExport
- then click
- Launch dashboard visualization app
- To launch visualization page, select
Launch Analytics Dashboard. -
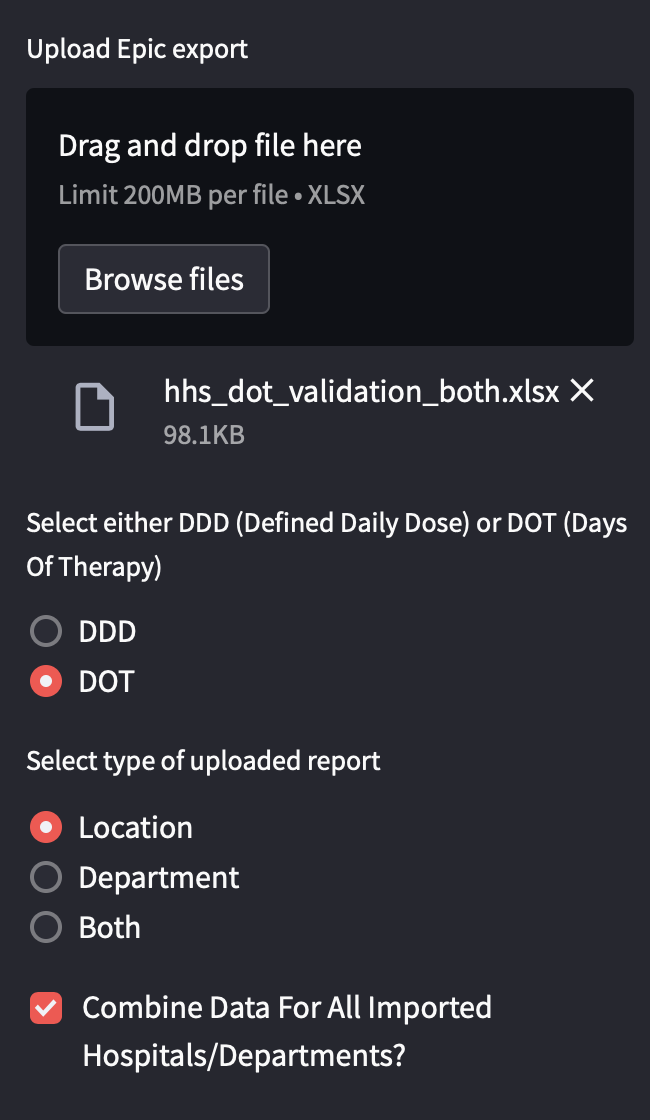
- Click Browse file to open file explorer and choose the output processed file.
- Then select either
DDDorDOT. - Select
location,departmentorbothfor later summarization table and graphs. -
- (Optional: Check "Combine Data For All Imported Hospitals/Departments" For HHS-wide data (medications can be selected at the next step).)
-
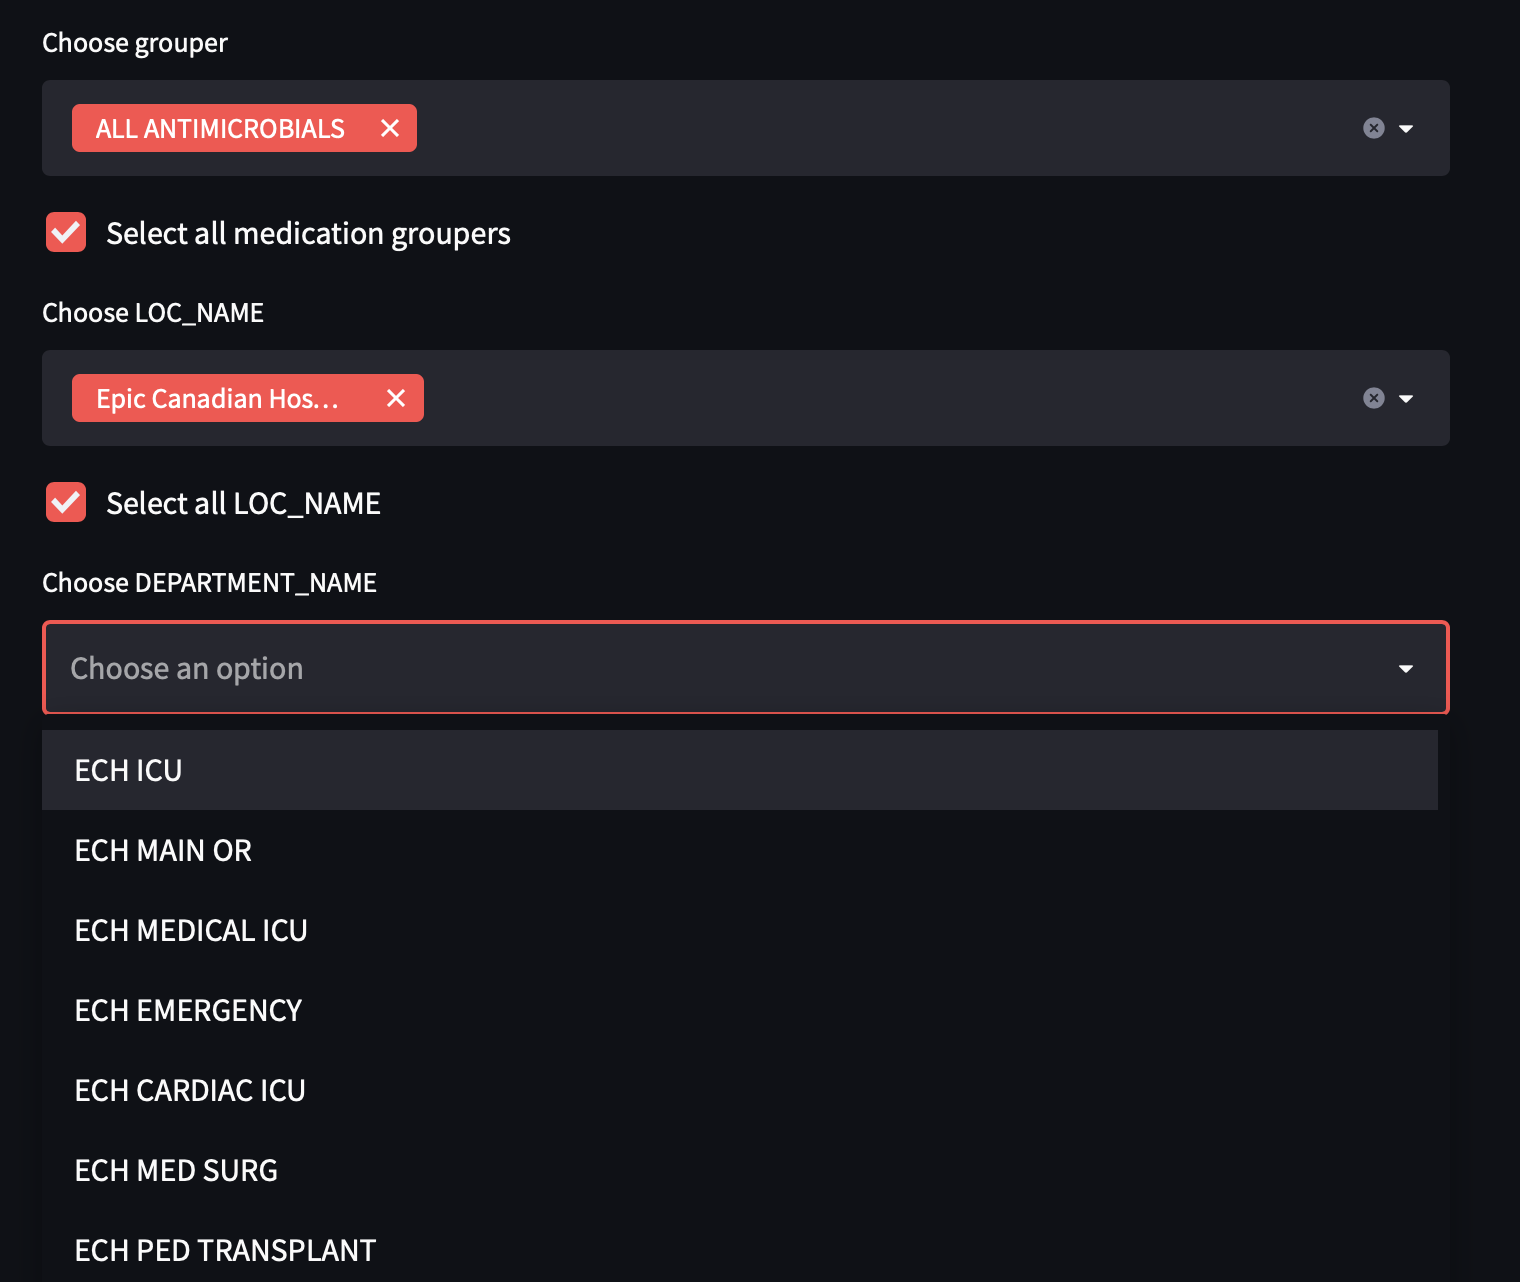
- Select
grouperof interested. - Then select level of data, list of departments will automatically filter based on locations selected.
-
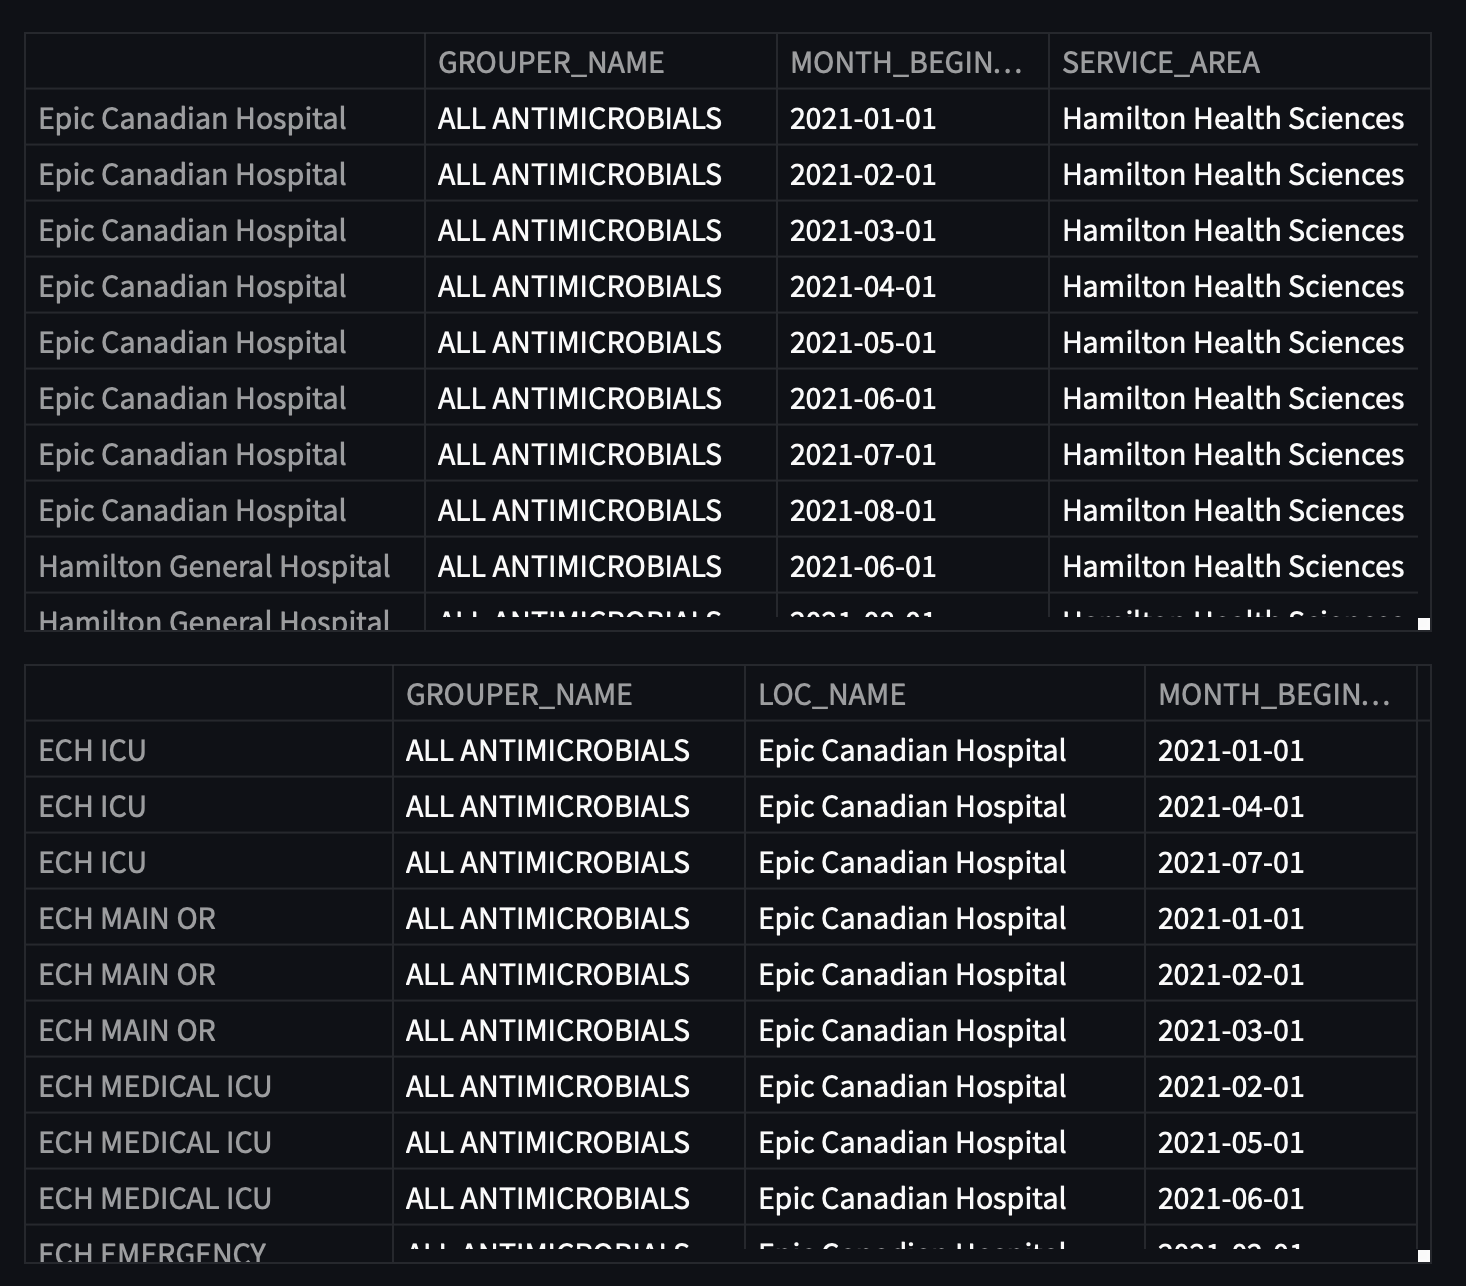
- Location or department data summary tables will display.
-
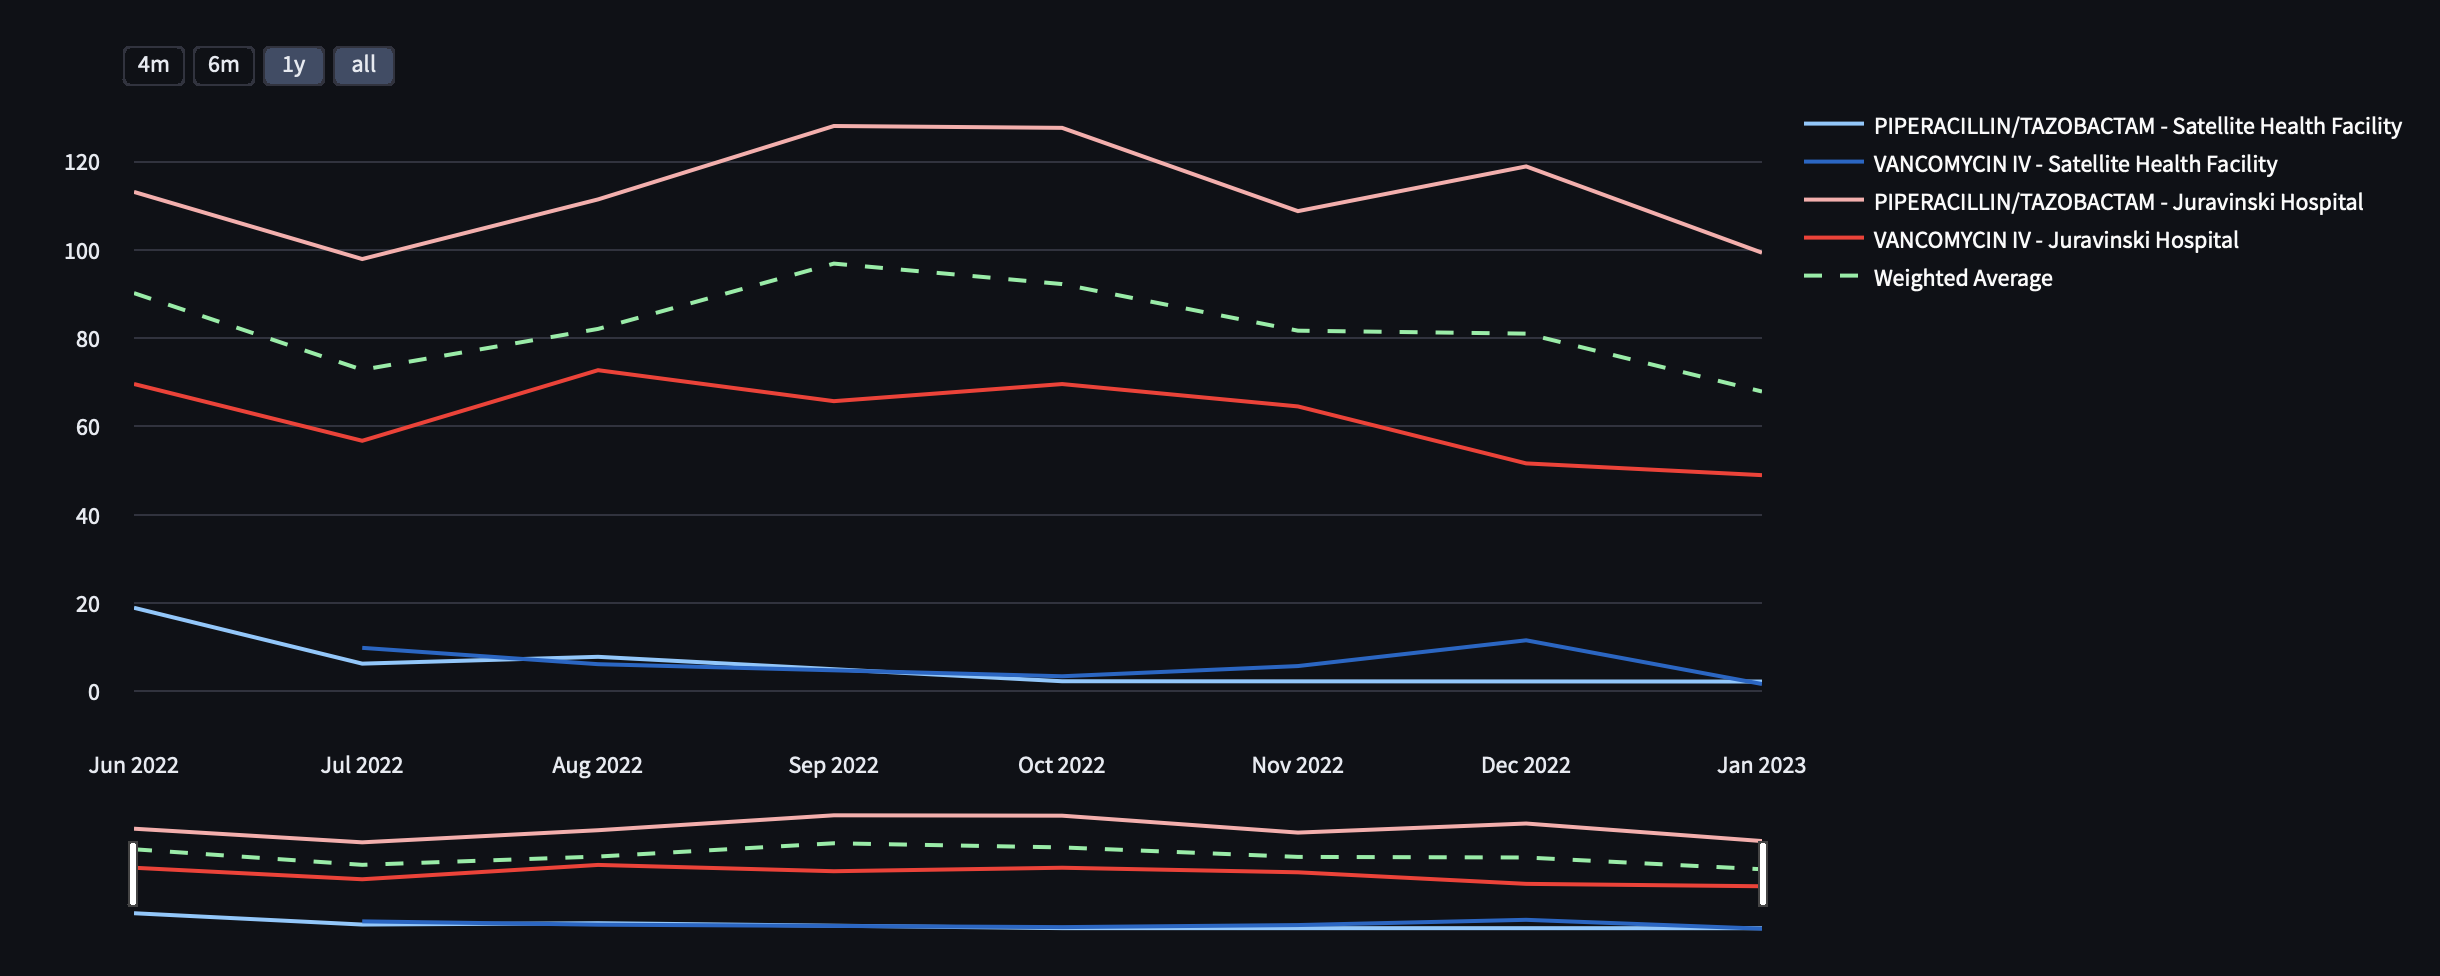
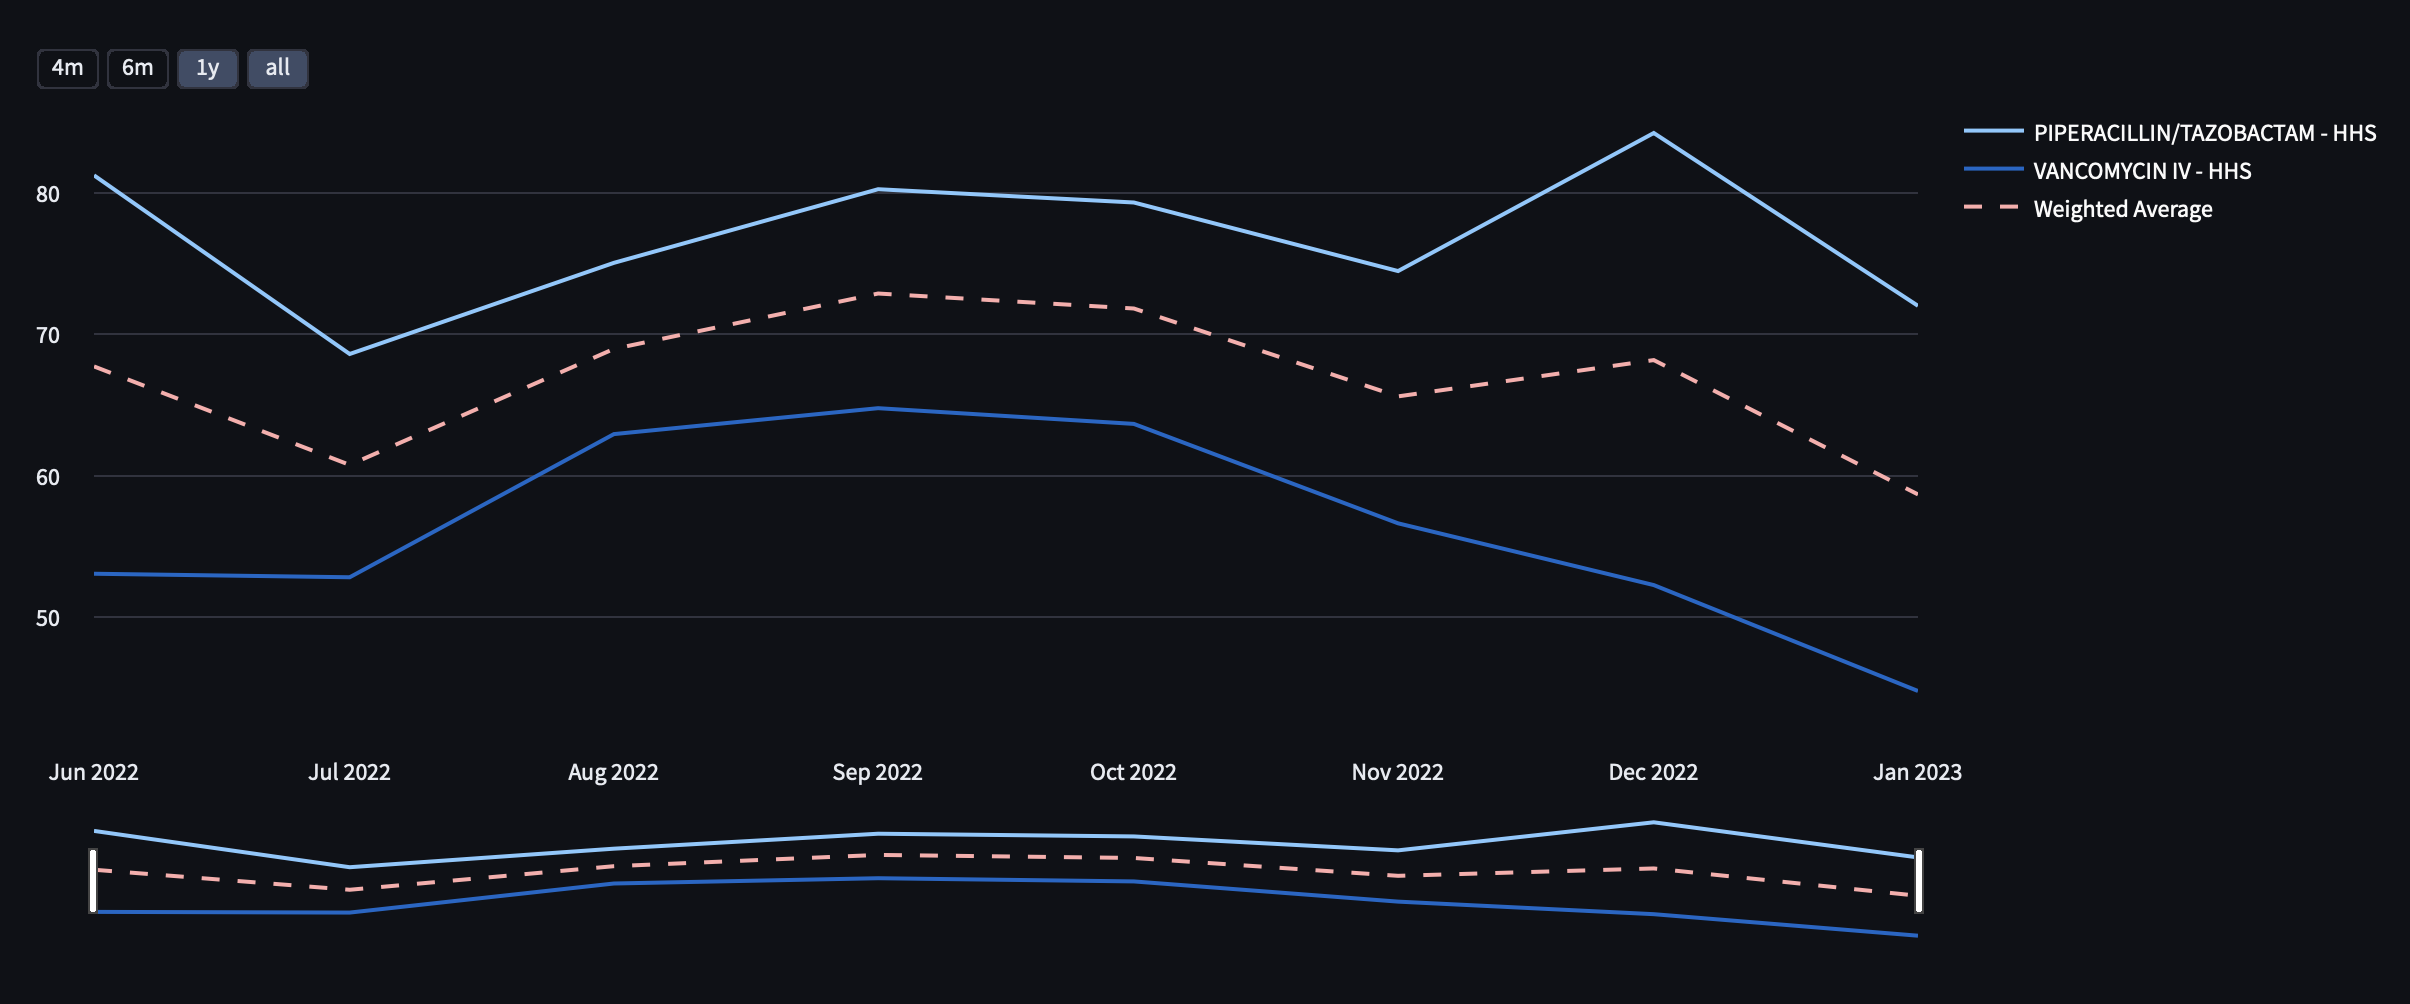
- Location or department line graphs will also display.
- to stop the web program, use "control + c" in terminal to stop the program