Analysis relationship between number of Starbuck store and Prosperity of city (Country) using R with the various package and Statistical hypothesis test
| Starbucks was first established in Seattle at 1971. Fifty years later, there are about 25,000 stores around the world, and Starbucks has become an important culture beyond just a cup of coffee. In urban area like Chicago and New York, we can easily see the Starbucks in every block but it is hard to see in the rural area. By observing this kind of situation, our group came up with a simple question: “what makes the difference?” Our group think that the number of Starbucks stores could be one of the indicators that represent the prosperity of city or country. To check our claim, we made a hypothesis: null hypothesis with “there is no relationship between the number of Starbucks stores and the indicators that represents the prosperity of city or country” versus the alternative hypothesis with “there is some relationship between the number of Starbucks stores and the indicators that represents the prosperity of city or country”. In other words, we set our hypothesis
$H_0: B_j = 0$ and$H_a: B_j \neq 0$ . Note that we used 7 variables including “GDP”, “Happiness Score”, “Cost of Living”, “Rent Price”, “Quality of Life”, "Safety index" and “Population”.
| Our group strongly believe that if we can answer out question and find such indicator, we can inversely estimate that indicator by counting number of Starbucks. Furthermore , our group strongly believe that inverse estimation can be used in various fields including economics, business administration, and social studies. For example, economists can predict the estimated GDP of a country by just counting the number of Starbucks, and social scientists can make a further research of how Starbucks and coffee impact people’s wellness and happiness. We expect Starbucks could be one of the important and indescribable index if our research has a meaningful result. In order to conduct our research, we first cleaned the data collected from variety sources and tested our hypothesis.
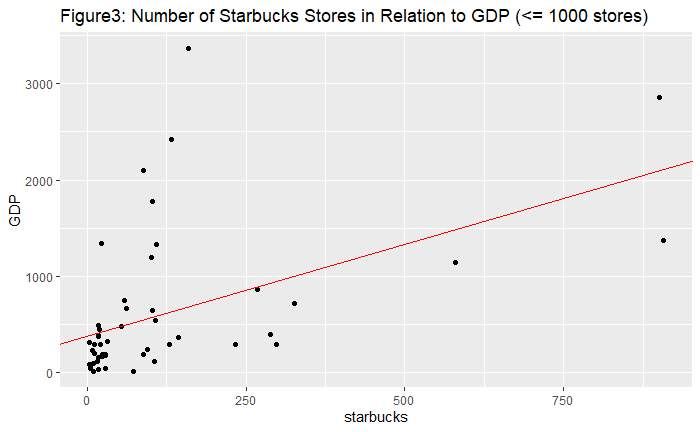
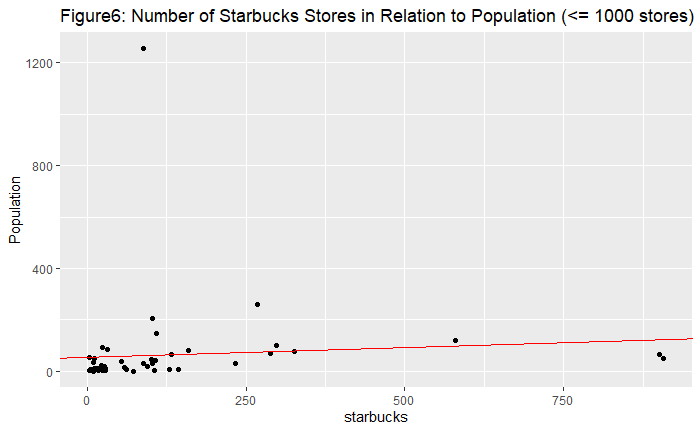
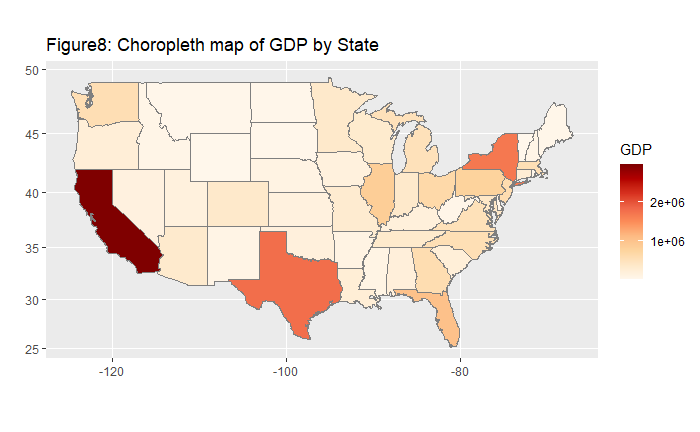
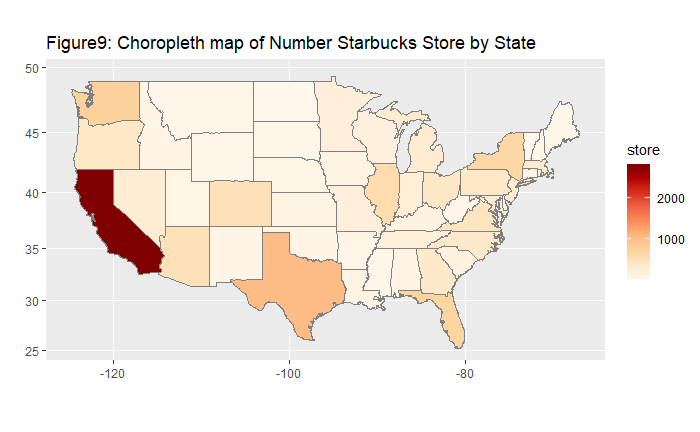
| We were interested in the relationship between the number of starbucks stores and other various countries' data. Then, we found out that United States had overwhelmingly many starbucks stores compared to other countries, so as a country scale, including United States in the data had the possibility of distorting data. Accordingly, we separated United States and delved into it in a more domestic and microscopic way. According to subsequent linear regression analyzing the correlation between the number of starbucks stores with other predictors on a U.S. state level, we discovered that 'GDP' was the most explanatory predictor. We found out the relation with GDP using linear regression model and geographic visualizations. Back to a country scale excluding United States, 'GDP' and 'Pouplation' of countries had higher correlation with the number of starbucks stores according to linear regression model. To quench our curiosity, we also went on to check non-linear association and re-confirmed that 'GDP' and 'Population were still statistically significant.
We have done by dissecting this project into two parts: United State's domestic level, and international level. By looking at U.S. domestic level and international level with United States, GDP was assumed to be the strong predictor correlated with the number of stores.
Of course, there existed limitation on these results. The number of stores in starbucks dataset was not accurate, due to missing countries (Italy) and wrong data inputs. Also, the correlation we found is not equivalent to causality. Therefore, more explanations and further analysis has to be done. Also, off the top of our head, we intuitively can predict that the more prosperous and richer the region or country is, the more starbucks stores located at. Though there was not a novel discovery in our project, it is an undeniable fact that 'GDP' is the powerful predictor correlated with the number of starbucks stores. To sum up, in terms of the indicators of 'GDP' and 'population' we were able to reject the null hypotheses.