- Measure System Performance: See how well the system handles concurrent users or processes.
- Estimating resources: Determining the hardware needed for deployment.
- Prevent Downtime: Ensure the system remains stable and responsive under load to avoid crashes or downtime in a production environment.
[ ] Response Time: The time the system takes to respond to a request.
[ ] Concurrent Users: The number of users actively interacting with the system simultaneously.
[ ] Latency: The time it takes for a request to reach the server and for the server to start processing it.
[ ] CPU Utilization: The percentage of CPU resources used by the system during the load test.
[ ] Memory Usage: The amount of memory consumed by the system during the load test.
When testing specific backend APIs, the focus is often on individual endpoints, measuring their response times, error rates, and handling under load. However, when our frontend triggers multiple API calls (after login) in parallel, we need to choose which type of testing approach
[ ] Backend loading test approach Replicate the API calls that the frontend makes, including the login request and subsequent API calls. Simulate HTTP load against those APIs.
[ ] Browser automation tool (end-to-end testing)
Simulate real user interactions with our web app.
[ ] Locust: allows you to define user behaviors, such as logging in and performing actions that trigger multiple API calls, which can be run under load to simulate real user activity.
[ ] Vegeta (for Individual APIs): You can use Vegeta to load test individual APIs, but for testing sequences or parallel calls, it may not be sufficient on its own.
[ ] Selenium, Playwright, ~~**chromedp**~~: For simulating user interactions in web browsers.
[ ] Profiling Go: understand the performance characteristics of your Go applications by measuring various aspects like CPU usage, memory allocation, goroutine usage, and more.
[ ] Prometheus + Grafana~~~~: Scrape data and visualization, but it seems to overkill this task since this stack is usually recommended for long-term server monitoring and data aggregation across large-scale systems.
The following estimations are based on the assumption that our application will be deployed on a single node. For deployments across n nodes, resource requirements can be estimated by dividing the total resources by n.
-
CPU Usage
[ ] 8 cores
[ ] 16 cores
-
Memory Usage
[ ] 4 GB
[ ] 8 GB
-
Concurrent users (login process)
[ ] 1000
[ ]
2000 -
According to Google, the average response time should be under 200 milliseconds as it gives the feeling of an instant response.
-
A web response time ranging between 200 milliseconds and 1 second is considered acceptable as users still likely won’t notice the delay.
locust to start locust UI
http://137.132.92.226:4088 host
docker stats ipm-load ipm-load-mysql ipm-load-es ipm-load-mongo resource monitoring
lscpu check number of CPUs
-
Setup load test service
-
Create test-database with 10k managers profile
-
Setup 4 services for load-testing purpose
-
-
Pre-login users and save tokens to txt file
-
Write Locust script
- Read tokens from file
- Simulate 12 APIs called when an user login
-
Tried to control resources for groups of containers (4 services)
- Found a way of using cgroup package
- However, SBIP recommend not to use it, since it can affects to the OS
- Alternative approach: Setup a cloud instance → time-consuming
-
Therefore
- Run the experiment with required load request
- Monitor containers when it reach the peak
- Estimate resources have to use
- Each user wait 2-5 secs to make another request, continously for 2 minutes
- Not waiting for each other, but WAIT TO MAKE ANOTHER REQUEST
- Main service:
- 8 CPUs
- 4Gb RAM
- mySQL:
- 8 CPUs
- 4Gb RAM

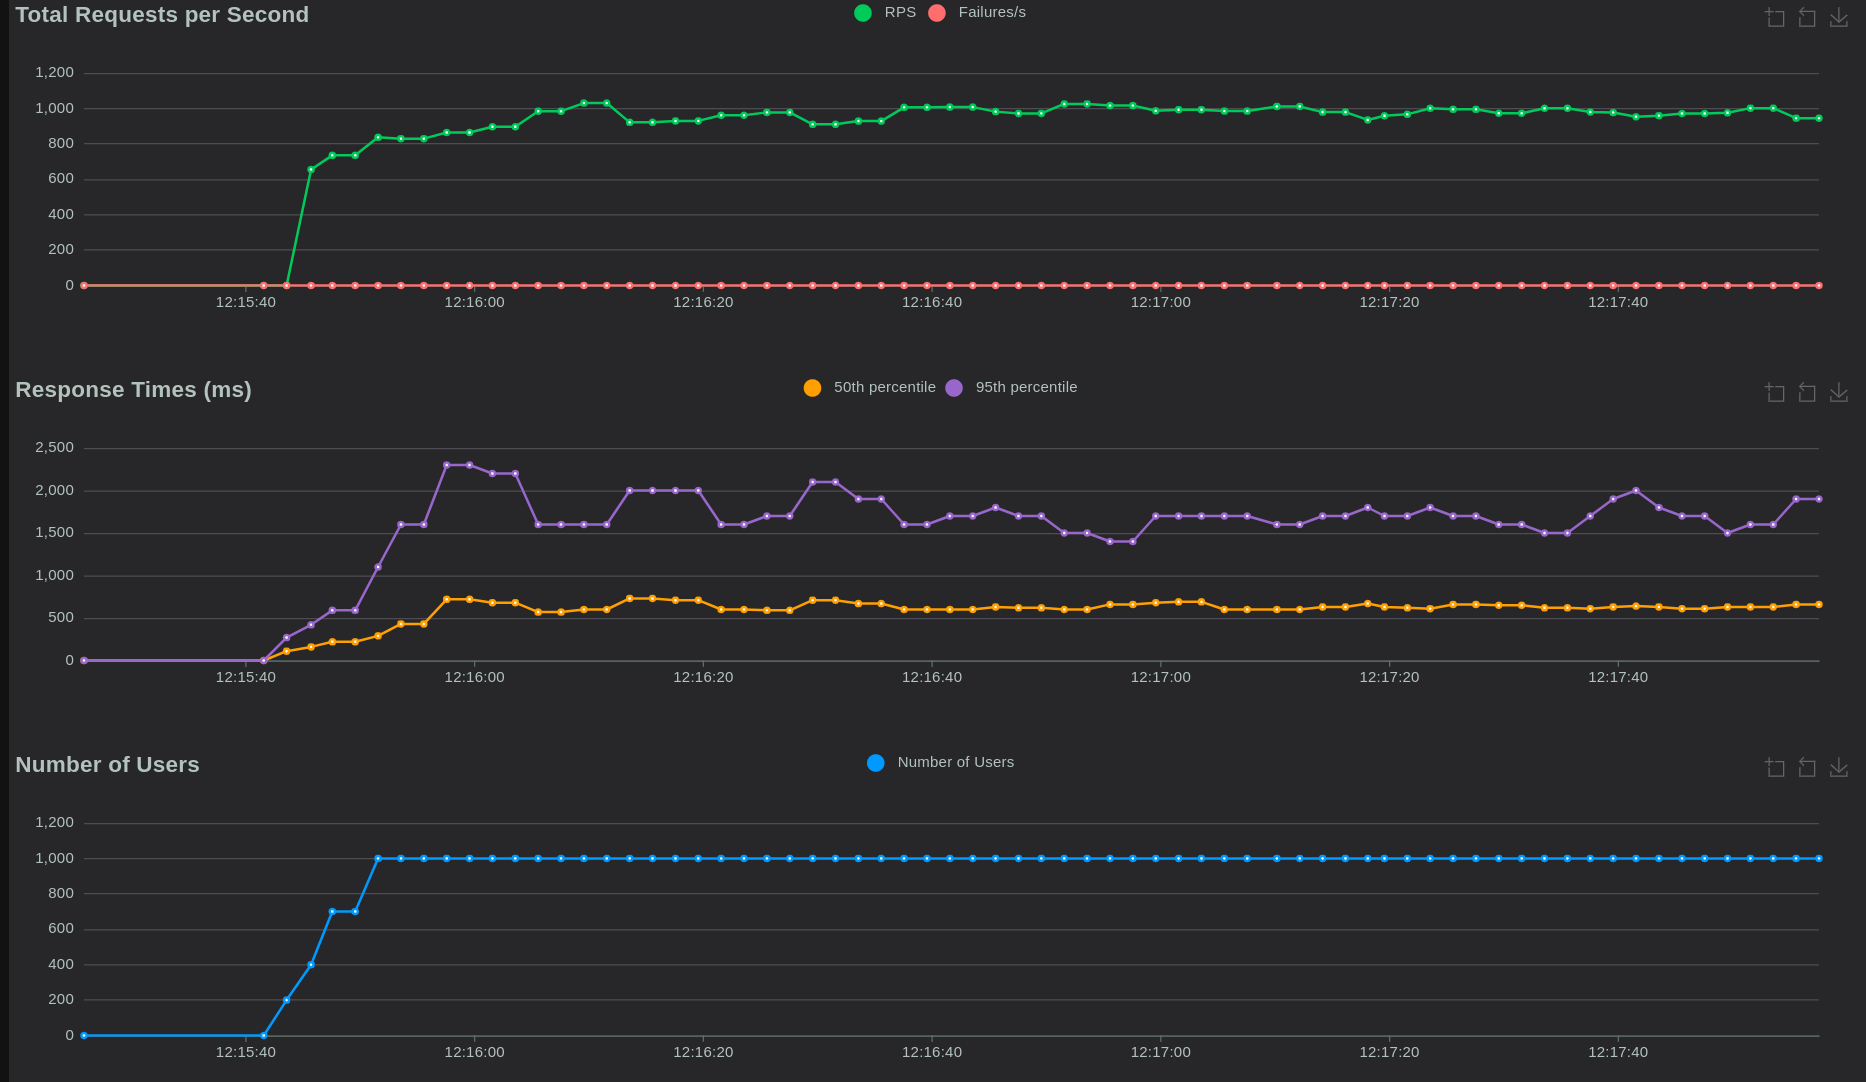
→ Handle nicely, p95 response time is ~700ms, acceptable

- Main service:
- 400-800% = 4-8 CPUs
- ~220Mb RAM
- mySQL:
- 200-400% = 2-4 CPUs
- 550Mb RAM
-
Main service:
- 12 CPUs
- 1Gb RAM
-
mySQL:
- 4 CPUs
- 2Gb RAM
-
Increase CPUs for main service
-
Decrease RAM for both
→ Response time reach to around 1700ms
- Main service:
- 8 CPUs
- 4Gb RAM
- mySQL:
- 4 CPUs
- 1Gb RAM
→ Same performance as the 1st try → Lower RAM mySQL service won’t affect high resquest scenario
- Main service:
- 8 CPUs
- 2Gb RAM
- mySQL:
- 4 CPUs
- 1Gb RAM
→ Same performance as the 1st try

Increase number of CPUs in main service to 12 won’t affect the outcome
Given 4 CPU + 16 GB RAM 2 CPU + 8 GB RAM
10k total user each user in first 1k user own 5 IP + 20 Patent + 10 Agr
[ ] 100 concurrent users = 5k invention = 20k patent = 10k agreement
Setup
[ ] Add ElasticSearch and Mongodb services to fully control and monitor [ ] 2 tasks Get - Update patent with ratio 9 - 1 1. Call get Patent CreatedBy with pageSize=20 2. Perform action (Get/Update) with random patent in above list


100 concurrent users will cost:
- < 2 CPU
- < 2.5Gb RAM
→ p95 response time < 70ms “Under 200 milliseconds as it gives the feeling of an instant response” - Google
With 4 CPU + 3Gb RAM, we could reach:
- 350 concurrent user
- p95 response time < 150ms


Contains the code for the data generator for the project.
Contains the code for the MySQL database for the project.
contains 10k managers to test 1k concurrent users.
contains 10k managers, 5k IP, 20k patent and 10k agreement
Contains the code for the deployment of the project.