#########################################################################################
NOTE: The visualization has employed hard-coded dimensions for certain elements. This requires the use of hardware conforming to certain specifications in order to use this visualization, as mentioned below:
Operating System: Windows 11
Resolution of Display: 1920 x 1080
Web Browser: Mozilla Firefox
Default Scaling of Web Browser: 100%
Default Scaling of Display: 125%
Git clone the entire folder to your system and run the index.html file on the web browser using simple http server to view the visualization.
Use Simple HTTP Server to launch the project.
#########################################################################################
Data transformation and analysis: Python
Version Control System (VCS): Git
Integrated Development Environment (IDE): VS Code, Google Colab
Note: This scenario and all the people, places, groups, technologies, etc contained herein are fictitious. Any resemblance to real people, places, groups, or technologies is purely coincidental.
In the roughly twenty years that Tethys-based GAStech has been operating a natural gas production site in the island country of Kronos, it has produced remarkable profits and developed strong relationships with the government of Kronos. However, GAStech has not been as successful in demonstrating environmental stewardship. In January, 2014, the leaders of GAStech are celebrating their new-found fortune as a result of the initial public offering of their very successful company. In the midst of this celebration, several employees of GAStech go missing. An organization known as the Protectors of Kronos (POK) is suspected in the disappearance, but things may not be what they seem. As an expert in visual analytics, you are called in to help law enforcement from Kronos and Tethys.
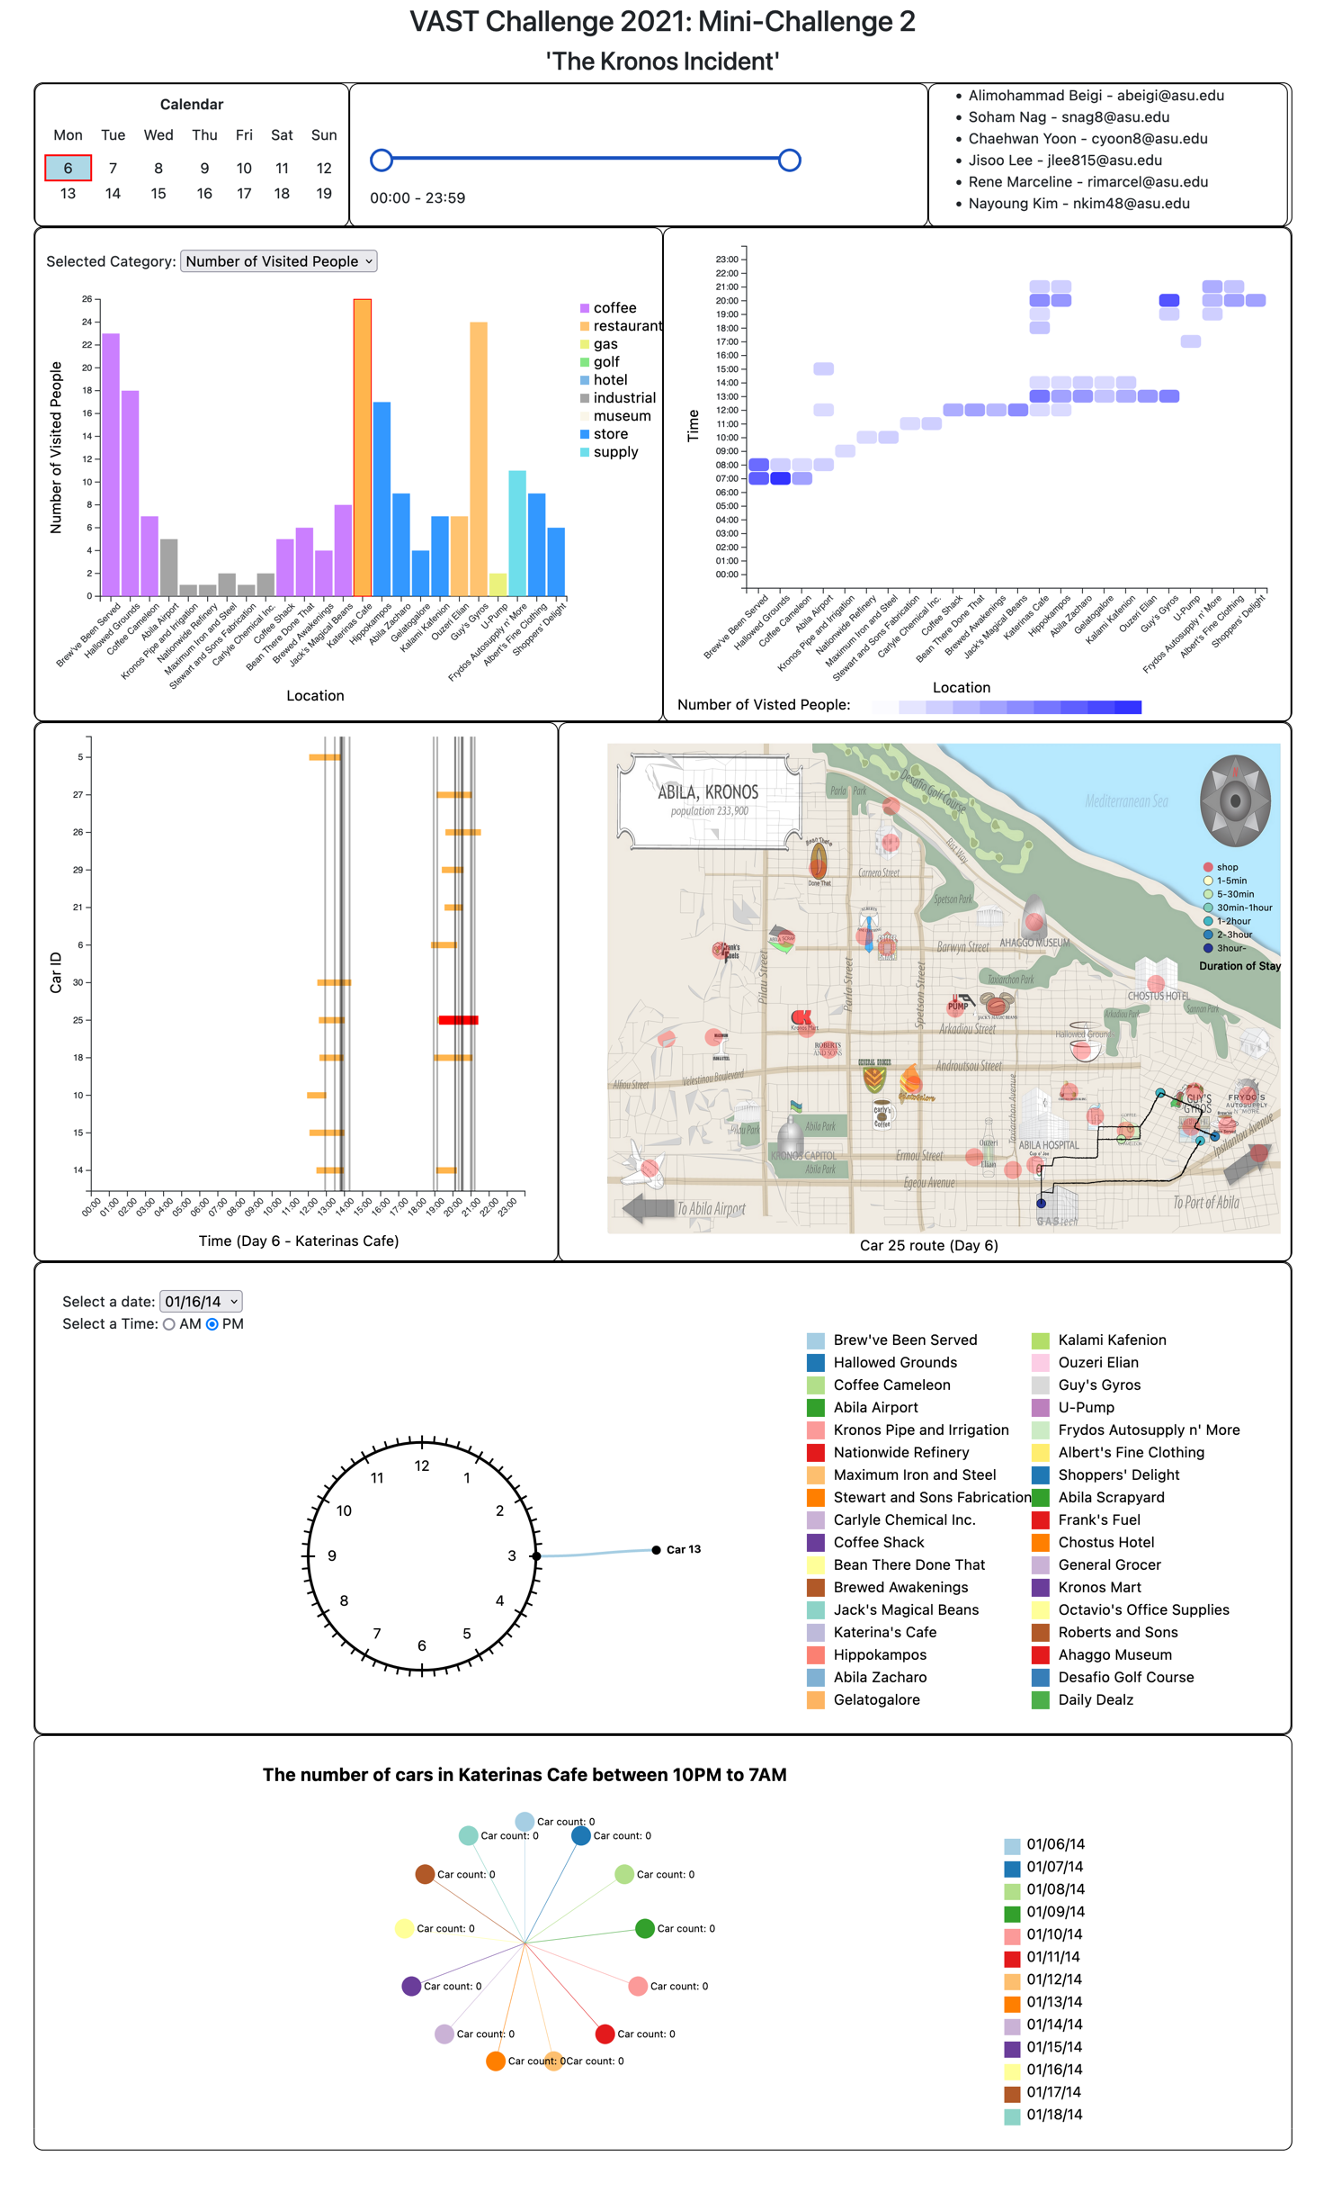
Mini-Challenge 2 asks you to analyze movement and tracking data. GAStech provides many of their employees with company cars for their personal and professional use, but unbeknownst to the employees, the cars are equipped with GPS tracking devices. You are given tracking data for the two weeks leading up to the disappearance, as well as credit card transactions and loyalty card usage data. From this data, can you identify anomalies and suspicious behaviors? Can you identify which people use which credit and loyalty cards?
The intended audience for this visualization the law enforcement of Kronos investigating the disappearance of employees. The goal is to create visually interesting and informative visualizations that can link all the datasets to infer meaningful information and highlight the employees exhibiting suspicious behaviour and the corresponding locations of those activities.
Four files were provided to aid the research. The first file held information about the employee, including their name, employee ID, department, and work title. Two files, pertaining to credit and loyalty cards, respectively, included information such as credit card number, loyalty card number, name, location, price, and timestamp. Finally, a file containing geospatial data information about the car's ID, timestamp, latitude and longitude was provided. Additionally, ESRI shapefiles of Kronos and Abila and a tourist map highlighting important landmarks and commercial areas was also provided.
While preparing the dataset we encountered a lot of difficulties. The GPS data is laid onto a map that allows for the identification of the employee's route, time of day, and any stops made along the way. However, some GPS data points were missing, and the map didn't have all locations on it.
The GPS data did not include any employee or location names. To overcome this issue, the car assignments file was used to infer the employees' names, while the location names were deduced by comparing them to credit card transactions and the tourist map.
The credit card and loyalty transaction data sets were merged based on the individual, data, and amount spent was used to calculate the number of visitors and the popularity of the location. The credit card data was similar to the loyalty card data, except for the timestamp. The loyalty card transactions only provided the date without the time of transaction.
Authors:
- Rene Marceline
- Alimohammad Beigi
- Chaehwan Yoon
- Jisoo Lee
- Nayoung Kim
- Soham Nag