- Just Open and try - Trade-Simulator
- The program will load with an interface containing several tabs
Trade Simulator is a web application for simulating stock exchange trading. The program allows you to:
- Load historical ticker data
- Practice trading strategies in playback mode
- Place buy/sell orders and stop orders
- Track profit, loss, and drawdown on your account
- Analyze trading results
p.s. Project uses IguanaCharts library for charting.
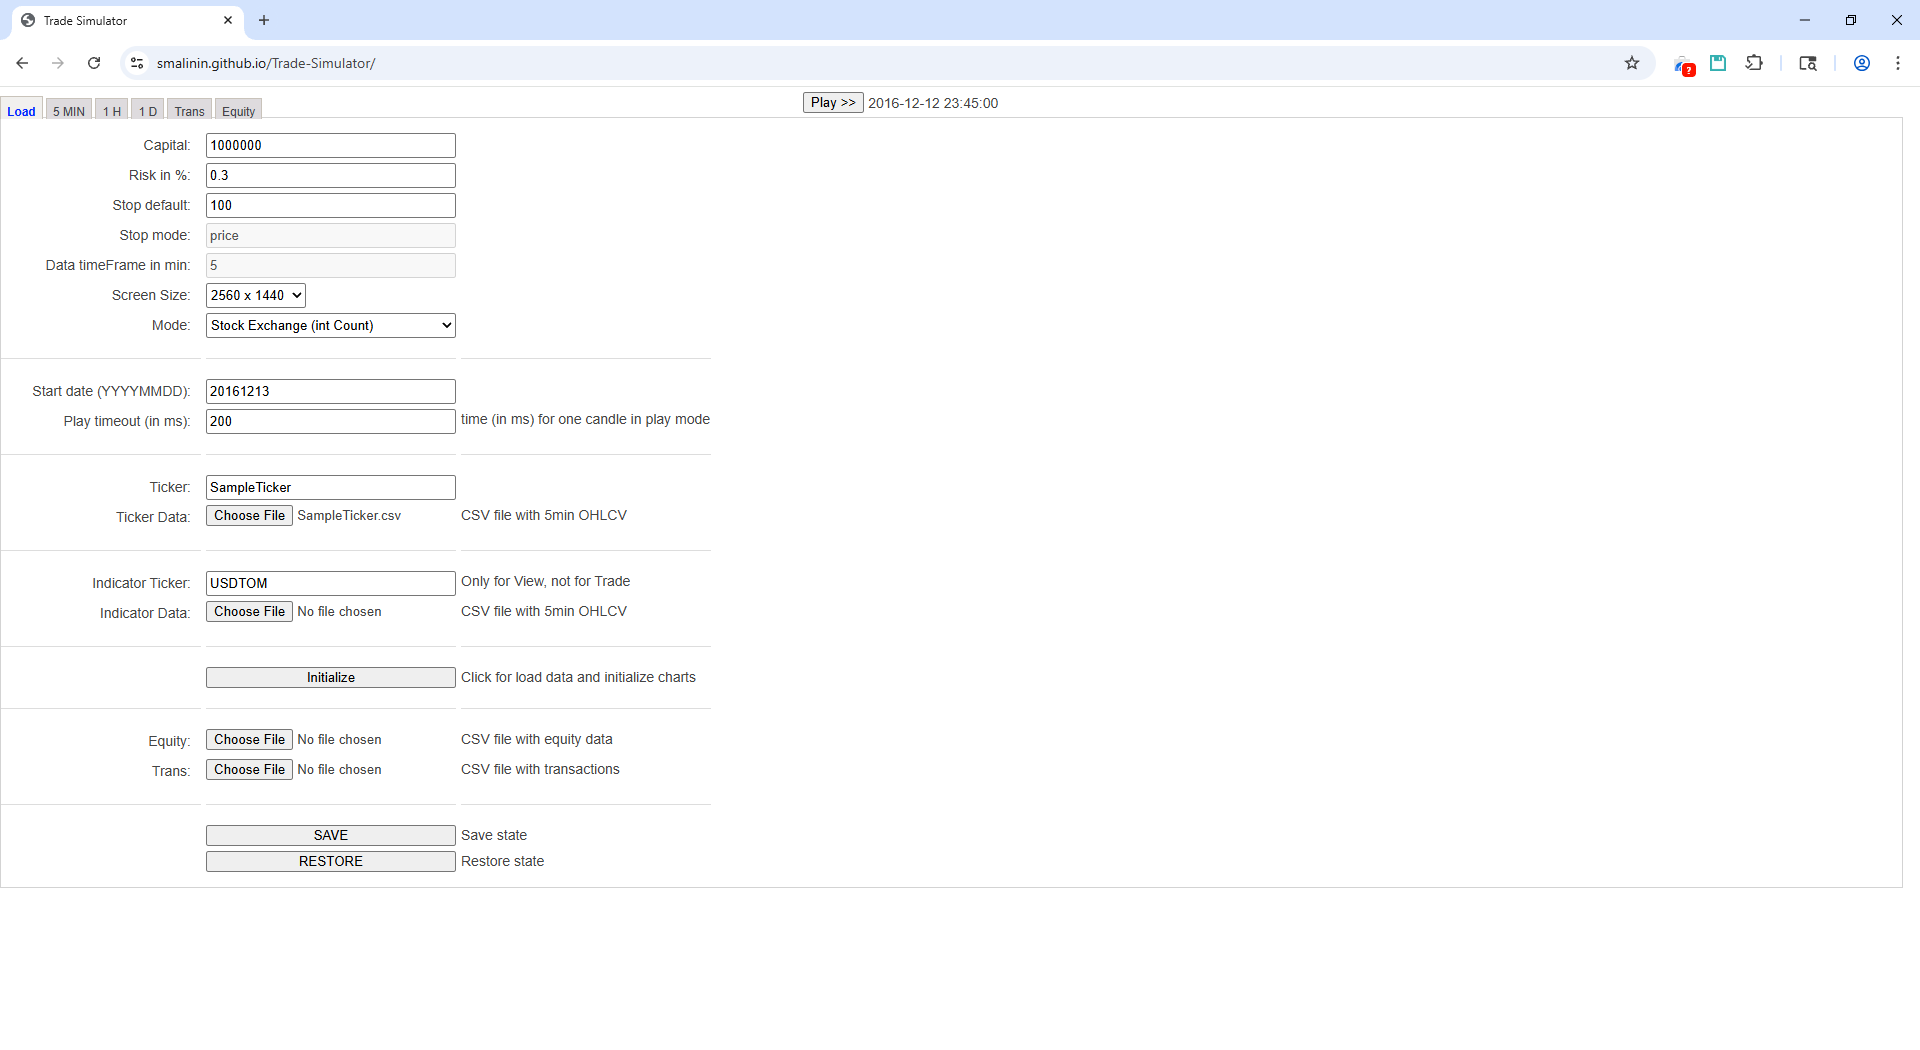
This is the main tab for initializing the program. Here you configure trading parameters and load data.
-
Capital — initial amount of money in the account (default: 1,000,000)
- The simulation starts with this amount
-
Risk in % — percentage of risk from capital per trade (default: 0.3%)
- Used when calculating position size
-
Stop default — default stop-loss in points (default: 100)
- Applied when calculating the stop
-
Stop mode — stop calculation mode (disabled, value: "price")
- Reserved for future use
-
Data timeframe in min — data timeframe in minutes (disabled, value: 5)
- Reserved for future use
-
Screen Size — screen size (default: 1980x1080)
- Affects the scaling of the interface and charts
- Available options: 1980x1080 (FHD), 2560x1440 (2K)
-
Mode — trading mode (default: Stock Exchange)
- Stock Exchange (int Count) — stock exchange, quantity in whole numbers
- Crypto Exchange (float Count) — crypto exchange, quantity in fractional numbers
-
Start date (YYYYMMDD) — simulation start date (default: 20161213)
- Format: YYYYMMDD (year-month-day)
- Example: 20220101 = January 1, 2022
-
Play timeout (in ms) — one candle playback time (default: 200 ms)
- The lower the value, the faster the simulation
- In Play mode, the program updates data at each timeout
-
Ticker — main ticker for trading (default: Si)
- Example: MSFT, APPL and etc
-
Ticker Data — load CSV file with data for the main ticker
- Must contain OHLCV data (Open, High, Low, Close, Volume) in 5min format
- Required CSV format (with semicolon separator):
or
DATE;TIME;OPEN;HIGH;LOW;CLOSE;VOLUME 20161017;1000;65300,0000000;65430,0000000;65263,0000000;65339,0000000;40 20161017;1005;65301,0000000;65319,0000000;65260,0000000;65294,0000000;418 20161017;1010;65297,0000000;65313,0000000;65290,0000000;65302,0000000;29 20161017;1015;65328,0000000;65328,0000000;65325,0000000;65325,0000000;50Datetime,Open,High,Low,Close,Volume 2024.11.01 00:00,2521.71,2522.3,2516.22,2520.1,3779.23 2024.11.01 00:05,2520.1,2521.59,2517.48,2519.61,1910.82
-
Indicator Ticker — additional ticker for display (like NASDAQ)
- Used only for visualization, not for trading
-
Indicator Data — load CSV file with indicator ticker data
- Same format as the main ticker:
or
DATE;TIME;OPEN;HIGH;LOW;CLOSE;VOLUME 20161017;1000;1,0500000;1,0530000;1,0490000;1,0510000;1000 20161017;1005;1,0510000;1,0520000;1,0500000;1,0515000;1200Datetime,Open,High,Low,Close,Volume 2024.11.01 00:00,2521.71,2522.3,2516.22,2520.1,3779.23 2024.11.01 00:05,2520.1,2521.59,2517.48,2519.61,1910.82
- Same format as the main ticker:
-
Equity — load CSV file with account capital data
- Used to load a previous state or for analysis
- CSV format:
Date,Capital,DrawDown
2016-12-13 10:00:00,1000000,0
2016-12-13 10:05:00,1000100,0
...
-
Trans — load CSV file with previous transactions
- Helps restore previous trading
- CSV format:
Date,Mode,Price,Count,Sum,Profit,DrawDown,Comment
2016-12-13 10:05:00,buy,67.234,100,6723.4,0,0,New position
...
-
[Initialize] — initialize the program with selected parameters
- After filling all fields and loading CSV files, click this button
- The program will load data and you can switch to other tabs
-
[SAVE] — save current state to browser local storage
- Auto-saves state when closing the browser
-
[RESTORE] — restore state from browser local storage
- Loads the last saved state
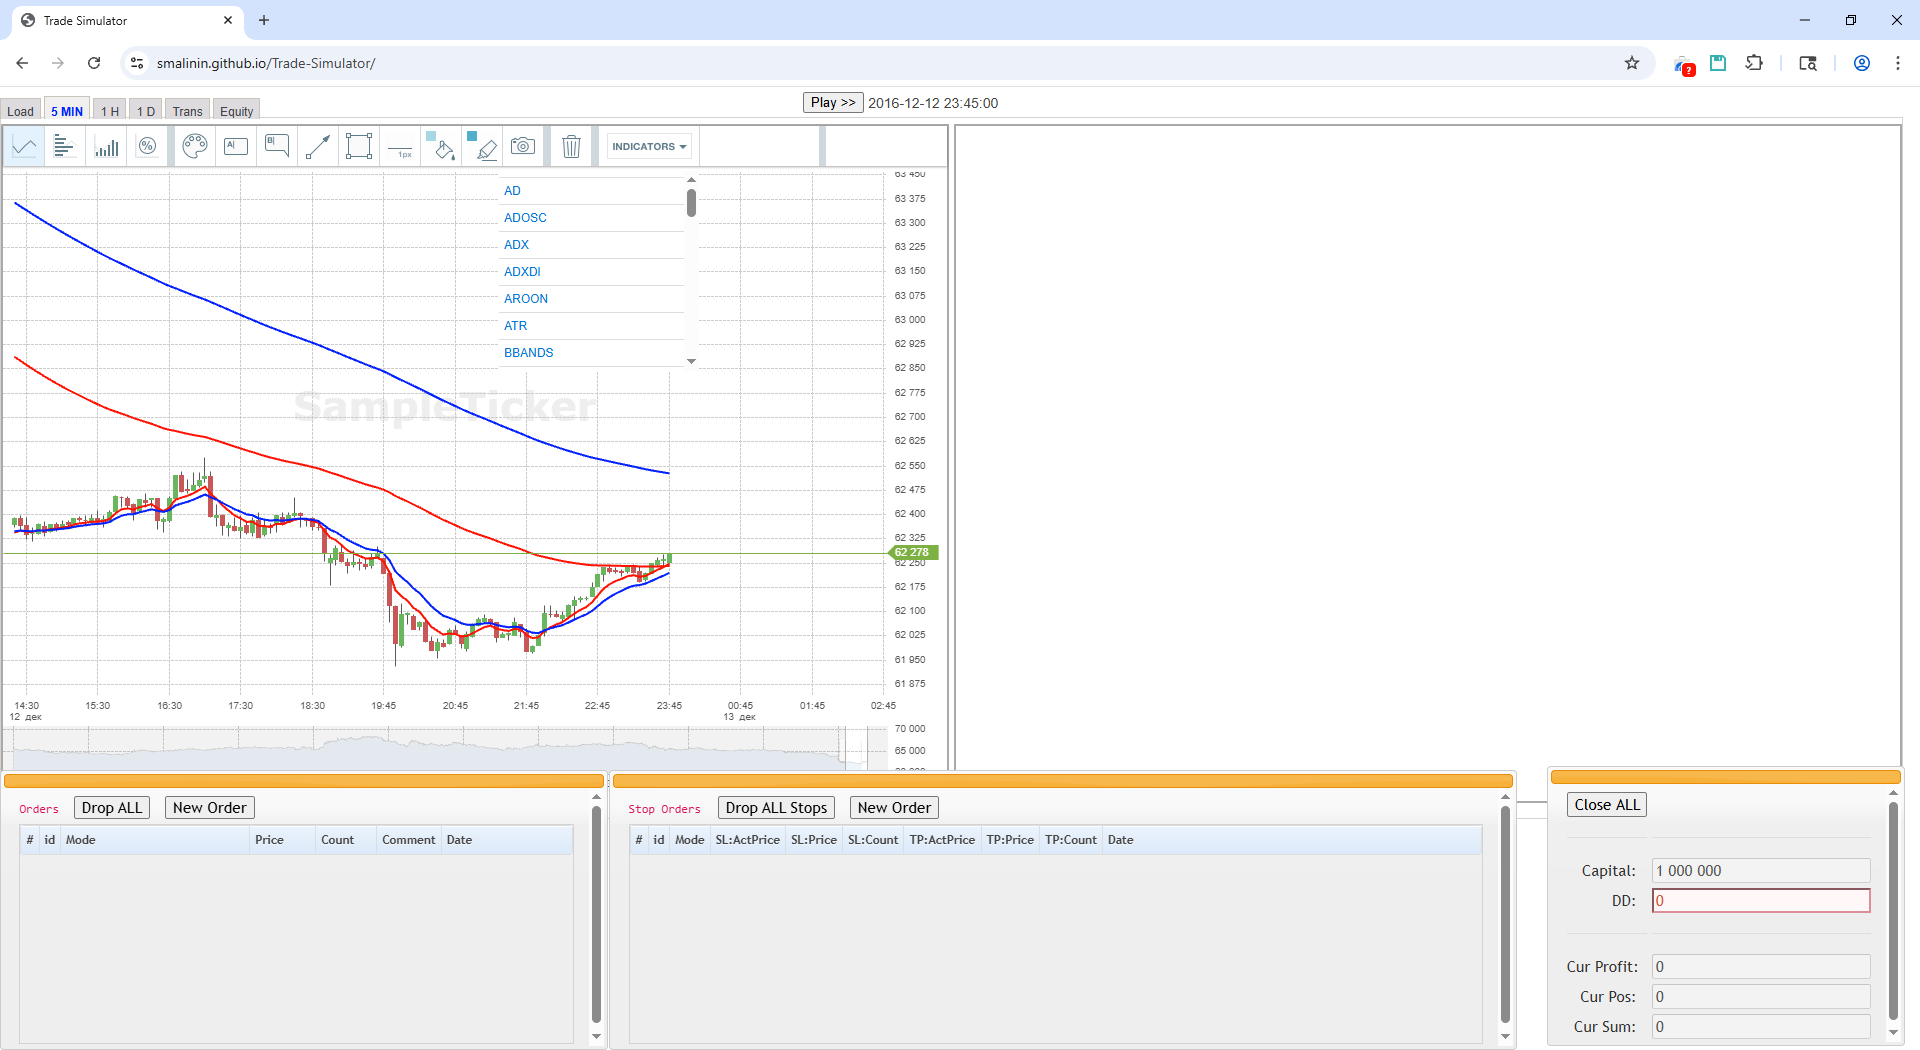
After clicking the [Initialize] button, chart tabs become available:
- 5 MIN — chart with 5-minute timeframe
- 1 H — chart with 1-hour timeframe
- 1 D — chart with 1-day timeframe
-
Two Charts Side by Side:
- Left chart — main ticker (for trading)
- Right chart — indicator ticker (for reference)
-
"Play >>" Button (top left):
- Click to start playing historical data
- During playback, the button becomes "Pause"
- Click again to pause
-
Current Date/Time (next to Play button)
- Shows the date and time of the current candle during playback
-
Left Order Management Panel (usually left of charts):
- Create new orders
- View and edit existing orders
- Set stop orders
Creating a New Order:
- Click on the desired price on the chart or use the "New Order" dialog
- Select type: Buy or Sell
- Specify price and quantity
- Click button to create the order
Editing an Order:
- Find the order in the current orders list
- Click on it to edit
- Change parameters and save
Deleting an Order:
- Select the order in the list
- Click "Delete" button or delete manually
Setting Stop Orders:
- After creating a main order, you can add stop-loss (SL) and take-profit (TP)
- SL (Stop-Loss) — order to close position at a loss
- TP (Take-Profit) — order to close position at a profit
Called when clicking the [New Order] button in the "Orders" panel.
Basic Parameters:
-
Mode — order type (Buy/Sell)
- Buy — purchase (green color)
- Sell — sale (red color)
-
Price — order price
- If left at 0, the order will execute at open/close price of the candle
- Two helper buttons:
- [Get Market] — inserts current ticker price into Price field
- [Calc Stop] — calculates stop amount using the formula:
The calculated Stop Activation price is inserted into the "Stop Activation" field
Stop = 2 × ATR(100)
if Stop > Stop_default:
    Stop = Stop_default
-
Count — number of contracts/shares
- [Calc Count] button — automatically calculates quantity based on:
- Set risk level (Risk in % on Load tab)
- Stop activation price (from "Stop Activation" field)
- Formula:
Count = (Capital × Risk%) / (Stop Activation - Price)
- [Calc Count] button — automatically calculates quantity based on:
Stop-Loss Parameters:
-
Stop Activation — stop order activation price
- When price reaches this level, stop-loss will trigger
-
Stop — stop order execution price
- Price at which position will close when stop triggers
Take-Profit Parameters:
-
Profit Activation — profit order activation price
- When price reaches this level, take-profit will trigger
-
Profit — profit order execution price
- Price at which position will close when profit triggers
Additional:
- Comment — comment for the order
- Helps track the reason for creating the order
- Saved in transaction history
Execution:
- When clicking [Execute] button, the following will be placed:
- Main buy/sell order
- Stop-loss order (if Stop Activation and Stop are specified)
- Take-profit order (if Profit Activation and Profit are specified)
Called when clicking the [New Order] button in the "Stop Orders" panel.
Used to create additional BuyStop/SellStop orders.
Basic Parameters:
- Mode — stop order type
- BuyStop — buy stop order (green color)
- SellStop — sell stop order (red color)
Stop-Loss Part:
-
SL: Stop Activation — stop order activation price for stop-loss
- When price reaches this level, SL order will trigger
-
SL: Stop — stop order execution price for stop-loss
- Position closing price when SL triggers
-
SL: Count — number of contracts/shares for stop-loss
- Separate quantity for this order
Take-Profit Part:
-
TP: Profit Activation — profit order activation price
- When price reaches this level, TP order will trigger
-
TP: Profit — profit order execution price
- Position closing price when TP triggers
-
TP: Count — number of contracts/shares for profit
- Separate quantity for this order
Features:
- Stop orders trigger automatically during data playback (Play mode)
- You can create multiple stop orders for one position
- Each stop order independently tracks activation levels
Displayed in a separate window and shows:
-
Capital — current account capital size
-
DD (DrawDown) — maximum drawdown from capital peak
- Shows maximum loss from the start of trading
-
Cur Profit — current profit/loss of open position
-
Cur Pos — current open position size (in number of contracts/shares)
-
Cur Sum — current open position amount
-
[Close ALL] — close all open positions with one button and delete all unexecuted orders
- Convenient for quick position exit without creating a new order
Table of all completed trades:
| Field | Description |
|---|---|
| # | Trade number |
| Date | Date and time of trade completion |
| Mode | Type: Buy (purchase) or Sell (sale) |
| Price | Order execution price |
| Count | Number of contracts/shares |
| Sum | Trade amount (Price × Count) |
| Profit | Trade profit/loss |
| DrawDown | Drawdown at the time of trade |
| Comment | Trade comment |
[Save] Button — save transactions table to CSV file for further analysis
Table of capital change history:
| Field | Description |
|---|---|
| Date | Date and time |
| Capital | Capital size at that moment |
| DrawDown | Drawdown at that moment |
[Save] Button — save capital table to CSV file
- Prepare a CSV file with historical ticker data
- CSV format (with semicolon separator):
or
DATE;TIME;OPEN;HIGH;LOW;CLOSE;VOLUME 20161017;1000;65300,0000000;65430,0000000;65263,0000000;65339,0000000;40 20161017;1005;65301,0000000;65319,0000000;65260,0000000;65294,0000000;418 20161017;1010;65297,0000000;65313,0000000;65290,0000000;65302,0000000;29 20161017;1015;65328,0000000;65328,0000000;65325,0000000;65325,0000000;50Datetime,Open,High,Low,Close,Volume 2024.11.01 00:00,2521.71,2522.3,2516.22,2520.1,3779.23 2024.11.01 00:05,2520.1,2521.59,2517.48,2519.61,1910.82 - Important Points:
- Dates must be in ascending order
- Time must correspond to timeframe (10:00, 10:05, 10:10, etc. for 5min)
- Open
index.htmlin your browser - On the Load tab:
- Set Capital (initial capital)
- Set Risk in % (risk per trade)
- Choose Mode (Stock Exchange or Crypto Exchange)
- Set Start date (start date)
- Set Play timeout (playback speed)
- Load CSV file into Ticker Data
- (Optional) Load indicator ticker data
- Click [Initialize]
- Go to the 5 MIN tab (or 1H, 1D)
- Click Play >> button to start playback
- Place orders as data plays
- Monitor profit/loss in the Status dialog
- Go to Trans tab to view all trades
- Go to Equity tab to view capital history
- Save data with [Save] button on each tab
- On the Load tab click [SAVE]
- State will be saved to browser local storage
- On next opening, click [RESTORE] to restore
- Use data in candle form (OHLCV)
- Ensure timestamps are in ascending order
- Check that prices are in the correct scale (e.g., in kopecks for ruble)
Stock Exchange (int Count):
- Use for stocks, futures
- Quantity always whole number
- Example: 100 Gazprom shares
Crypto Exchange (float Count):
- Use for cryptocurrencies
- Quantity can be fractional
- Example: 0.5 BTC
- Play timeout: 100-500 ms for normal playback speed
- Risk in %: 0.3-2% depending on strategy
- Stop default: 50-200 points depending on volatility
- SL (Stop Loss): Activates at price, closes position with loss
- TP (Take Profit): Activates at price, closes position with profit
- Both order types trigger automatically during Play
- Play/Pause: Play >> button on each tab
- Close ALL: Button in Status dialog for quick position closure
- Chrome 60+
- Firefox 55+
- Edge 79+
- Safari 12+
Chrome or Firefox is recommended for best compatibility.
- Check CSV file format
- Ensure start dates are correct
- Try clicking [Initialize] again
- Make sure Play mode is enabled
- Check that order price is within current candle range
- Check stop-loss and take-profit setup
- Check if browser local storage is enabled
- Try clearing browser cache
- Avoid using private mode (may prevent saving)
The program uses the following libraries:
- jQuery 1.12.4
- UIKit
- jsRender
- PapaParse
- jQuery.qtip
- jQuery.easing
- jQuery-ui
- Hammer.js
- IguanaChart
The program is distributed under GPL 3.0 license
Version: 1.1